Immigrants from Armenia vs Belizean Single Father Households
COMPARE
Immigrants from Armenia
Belizean
Single Father Households
Single Father Households Comparison
Immigrants from Armenia
Belizeans
2.1%
SINGLE FATHER HOUSEHOLDS
99.5/ 100
METRIC RATING
89th/ 347
METRIC RANK
2.6%
SINGLE FATHER HOUSEHOLDS
0.2/ 100
METRIC RATING
272nd/ 347
METRIC RANK
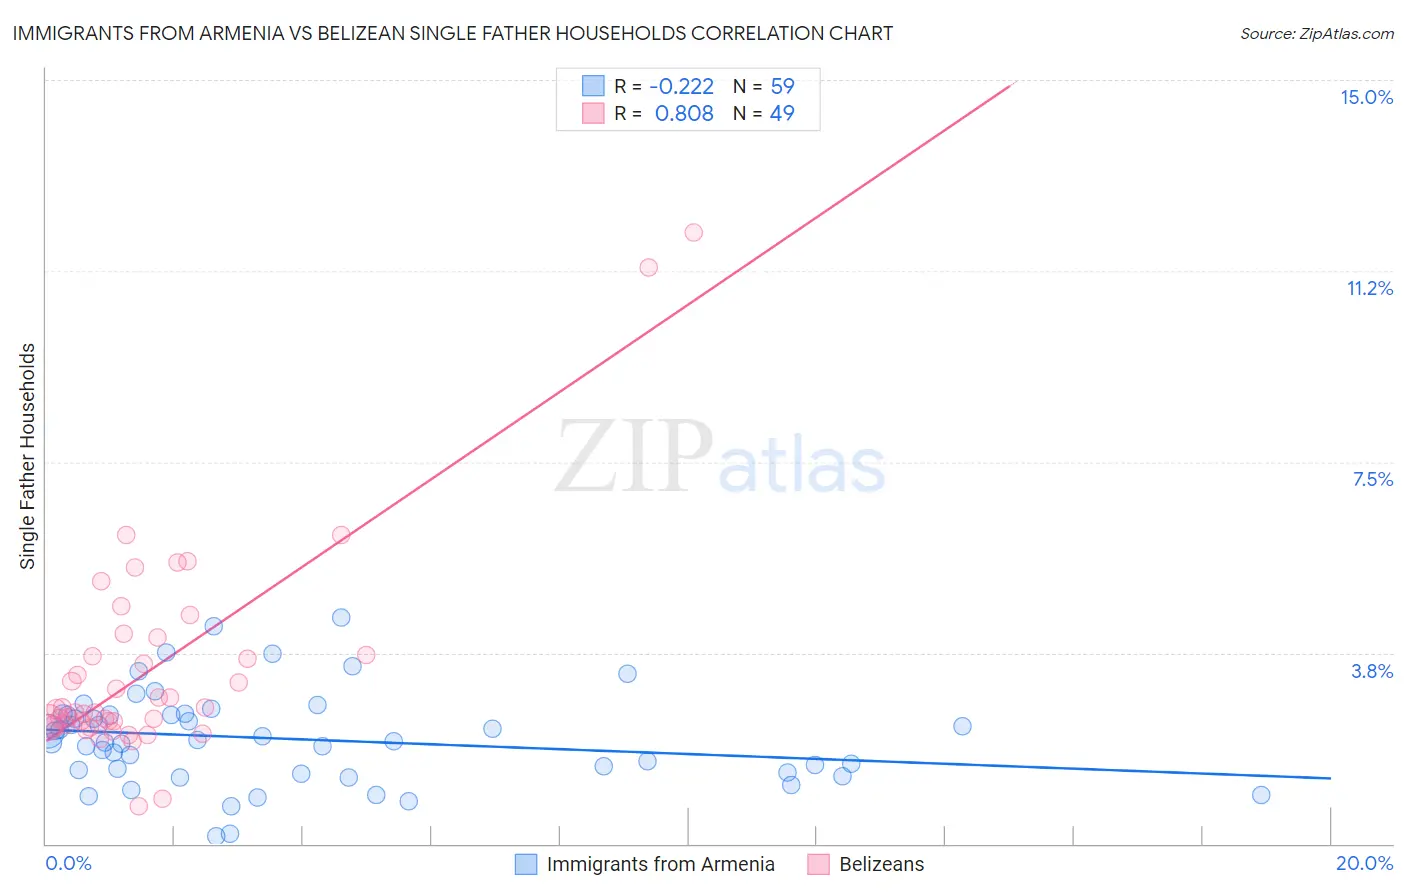
Immigrants from Armenia vs Belizean Single Father Households Correlation Chart
The statistical analysis conducted on geographies consisting of 97,547,351 people shows a weak negative correlation between the proportion of Immigrants from Armenia and percentage of single father households in the United States with a correlation coefficient (R) of -0.222 and weighted average of 2.1%. Similarly, the statistical analysis conducted on geographies consisting of 143,901,350 people shows a very strong positive correlation between the proportion of Belizeans and percentage of single father households in the United States with a correlation coefficient (R) of 0.808 and weighted average of 2.6%, a difference of 23.1%.
Single Father Households Correlation Summary
| Measurement | Immigrants from Armenia | Belizean |
| Minimum | 0.15% | 0.75% |
| Maximum | 4.4% | 12.0% |
| Range | 4.3% | 11.3% |
| Mean | 2.1% | 3.4% |
| Median | 2.0% | 2.6% |
| Interquartile 25% (IQ1) | 1.4% | 2.3% |
| Interquartile 75% (IQ3) | 2.5% | 3.9% |
| Interquartile Range (IQR) | 1.1% | 1.6% |
| Standard Deviation (Sample) | 0.91% | 2.1% |
| Standard Deviation (Population) | 0.91% | 2.1% |
Similar Demographics by Single Father Households
Demographics Similar to Immigrants from Armenia by Single Father Households
In terms of single father households, the demographic groups most similar to Immigrants from Armenia are Immigrants from Pakistan (2.1%, a difference of 0.010%), Bhutanese (2.1%, a difference of 0.050%), Lithuanian (2.1%, a difference of 0.18%), Immigrants from Guyana (2.1%, a difference of 0.25%), and Romanian (2.1%, a difference of 0.34%).
| Demographics | Rating | Rank | Single Father Households |
| New Zealanders | 99.7 /100 | #82 | Exceptional 2.1% |
| Greeks | 99.7 /100 | #83 | Exceptional 2.1% |
| Carpatho Rusyns | 99.6 /100 | #84 | Exceptional 2.1% |
| Immigrants | Hungary | 99.6 /100 | #85 | Exceptional 2.1% |
| Asians | 99.6 /100 | #86 | Exceptional 2.1% |
| Lithuanians | 99.5 /100 | #87 | Exceptional 2.1% |
| Bhutanese | 99.5 /100 | #88 | Exceptional 2.1% |
| Immigrants | Armenia | 99.5 /100 | #89 | Exceptional 2.1% |
| Immigrants | Pakistan | 99.5 /100 | #90 | Exceptional 2.1% |
| Immigrants | Guyana | 99.4 /100 | #91 | Exceptional 2.1% |
| Romanians | 99.4 /100 | #92 | Exceptional 2.1% |
| Croatians | 99.3 /100 | #93 | Exceptional 2.1% |
| Ukrainians | 99.3 /100 | #94 | Exceptional 2.1% |
| Bermudans | 99.2 /100 | #95 | Exceptional 2.1% |
| Arabs | 99.2 /100 | #96 | Exceptional 2.1% |
Demographics Similar to Belizeans by Single Father Households
In terms of single father households, the demographic groups most similar to Belizeans are Creek (2.6%, a difference of 0.0%), Iroquois (2.6%, a difference of 0.040%), Puerto Rican (2.6%, a difference of 0.070%), Seminole (2.6%, a difference of 0.37%), and Immigrants from Dominican Republic (2.6%, a difference of 0.49%).
| Demographics | Rating | Rank | Single Father Households |
| Immigrants | Micronesia | 0.5 /100 | #265 | Tragic 2.6% |
| French American Indians | 0.5 /100 | #266 | Tragic 2.6% |
| Guamanians/Chamorros | 0.4 /100 | #267 | Tragic 2.6% |
| Haitians | 0.4 /100 | #268 | Tragic 2.6% |
| Cubans | 0.3 /100 | #269 | Tragic 2.6% |
| Seminole | 0.3 /100 | #270 | Tragic 2.6% |
| Creek | 0.2 /100 | #271 | Tragic 2.6% |
| Belizeans | 0.2 /100 | #272 | Tragic 2.6% |
| Iroquois | 0.2 /100 | #273 | Tragic 2.6% |
| Puerto Ricans | 0.2 /100 | #274 | Tragic 2.6% |
| Immigrants | Dominican Republic | 0.2 /100 | #275 | Tragic 2.6% |
| Immigrants | Haiti | 0.1 /100 | #276 | Tragic 2.6% |
| Shoshone | 0.1 /100 | #277 | Tragic 2.6% |
| Cherokee | 0.1 /100 | #278 | Tragic 2.6% |
| Samoans | 0.1 /100 | #279 | Tragic 2.6% |