Iranian vs Immigrants from Honduras Single Father Households
COMPARE
Iranian
Immigrants from Honduras
Single Father Households
Single Father Households Comparison
Iranians
Immigrants from Honduras
1.9%
SINGLE FATHER HOUSEHOLDS
100.0/ 100
METRIC RATING
19th/ 347
METRIC RANK
2.8%
SINGLE FATHER HOUSEHOLDS
0.0/ 100
METRIC RATING
303rd/ 347
METRIC RANK
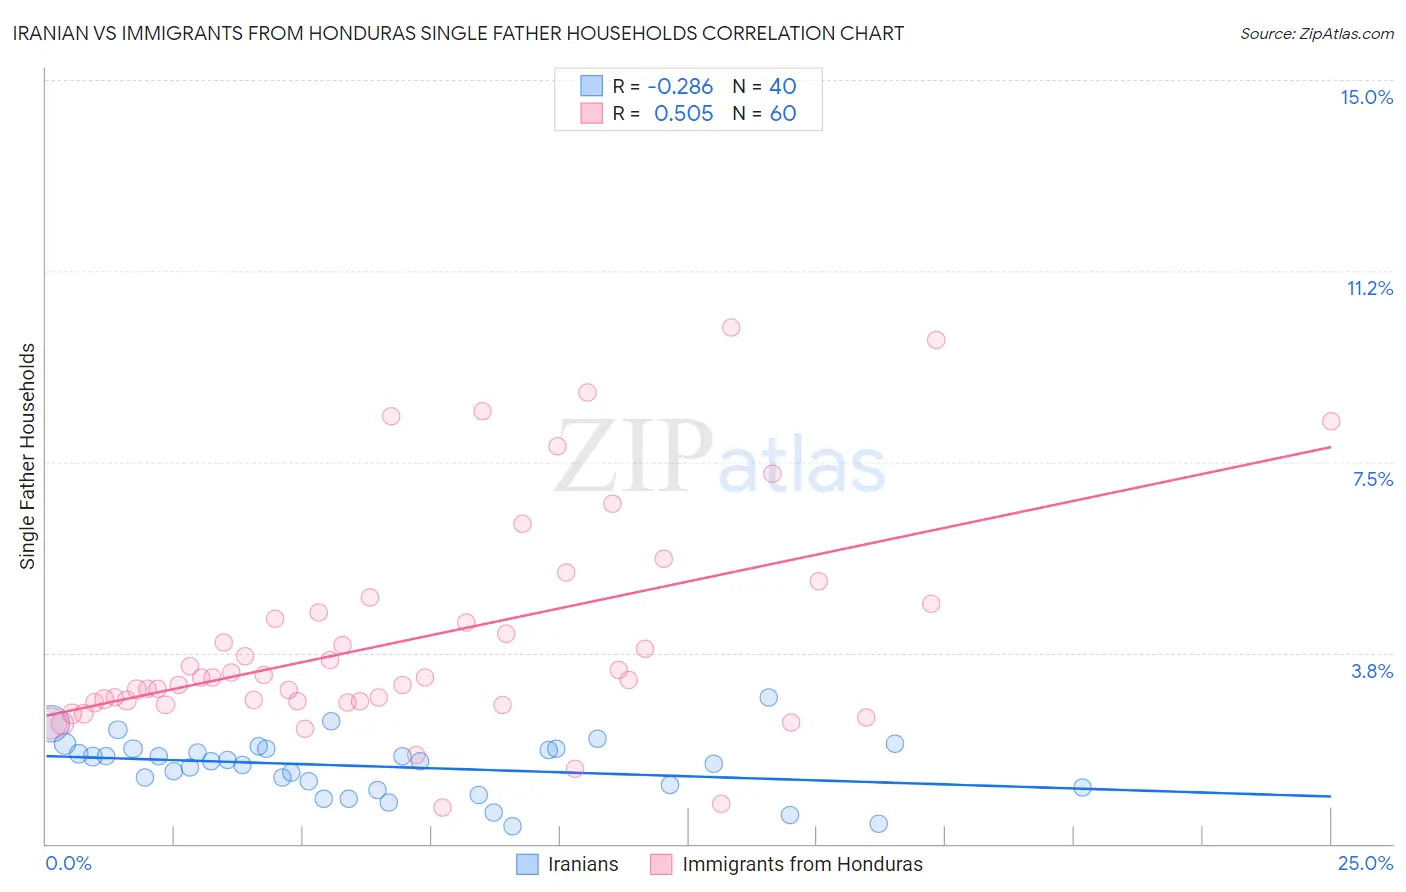
Iranian vs Immigrants from Honduras Single Father Households Correlation Chart
The statistical analysis conducted on geographies consisting of 314,844,289 people shows a weak negative correlation between the proportion of Iranians and percentage of single father households in the United States with a correlation coefficient (R) of -0.286 and weighted average of 1.9%. Similarly, the statistical analysis conducted on geographies consisting of 320,953,127 people shows a substantial positive correlation between the proportion of Immigrants from Honduras and percentage of single father households in the United States with a correlation coefficient (R) of 0.505 and weighted average of 2.8%, a difference of 46.0%.
Single Father Households Correlation Summary
| Measurement | Iranian | Immigrants from Honduras |
| Minimum | 0.34% | 0.70% |
| Maximum | 2.9% | 10.1% |
| Range | 2.5% | 9.4% |
| Mean | 1.5% | 4.0% |
| Median | 1.6% | 3.3% |
| Interquartile 25% (IQ1) | 1.1% | 2.8% |
| Interquartile 75% (IQ3) | 1.9% | 4.6% |
| Interquartile Range (IQR) | 0.73% | 1.9% |
| Standard Deviation (Sample) | 0.56% | 2.2% |
| Standard Deviation (Population) | 0.55% | 2.1% |
Similar Demographics by Single Father Households
Demographics Similar to Iranians by Single Father Households
In terms of single father households, the demographic groups most similar to Iranians are Thai (1.9%, a difference of 0.070%), Immigrants from Albania (1.9%, a difference of 0.37%), Immigrants from Latvia (1.9%, a difference of 0.56%), Indian (Asian) (1.9%, a difference of 0.84%), and Immigrants from India (1.9%, a difference of 1.3%).
| Demographics | Rating | Rank | Single Father Households |
| Immigrants | Greece | 100.0 /100 | #12 | Exceptional 1.9% |
| Immigrants | Singapore | 100.0 /100 | #13 | Exceptional 1.9% |
| Immigrants | Lithuania | 100.0 /100 | #14 | Exceptional 1.9% |
| Immigrants | Eastern Asia | 100.0 /100 | #15 | Exceptional 1.9% |
| Immigrants | Iran | 100.0 /100 | #16 | Exceptional 1.9% |
| Immigrants | India | 100.0 /100 | #17 | Exceptional 1.9% |
| Indians (Asian) | 100.0 /100 | #18 | Exceptional 1.9% |
| Iranians | 100.0 /100 | #19 | Exceptional 1.9% |
| Thais | 100.0 /100 | #20 | Exceptional 1.9% |
| Immigrants | Albania | 100.0 /100 | #21 | Exceptional 1.9% |
| Immigrants | Latvia | 100.0 /100 | #22 | Exceptional 1.9% |
| Immigrants | Croatia | 100.0 /100 | #23 | Exceptional 2.0% |
| Immigrants | Russia | 100.0 /100 | #24 | Exceptional 2.0% |
| Eastern Europeans | 100.0 /100 | #25 | Exceptional 2.0% |
| Assyrians/Chaldeans/Syriacs | 100.0 /100 | #26 | Exceptional 2.0% |
Demographics Similar to Immigrants from Honduras by Single Father Households
In terms of single father households, the demographic groups most similar to Immigrants from Honduras are Spanish American (2.8%, a difference of 0.020%), Mexican American Indian (2.8%, a difference of 0.32%), Hispanic or Latino (2.8%, a difference of 0.47%), Immigrants from Latin America (2.8%, a difference of 0.55%), and Kiowa (2.8%, a difference of 0.60%).
| Demographics | Rating | Rank | Single Father Households |
| Japanese | 0.0 /100 | #296 | Tragic 2.8% |
| Hondurans | 0.0 /100 | #297 | Tragic 2.8% |
| Cree | 0.0 /100 | #298 | Tragic 2.8% |
| Lumbee | 0.0 /100 | #299 | Tragic 2.8% |
| Kiowa | 0.0 /100 | #300 | Tragic 2.8% |
| Immigrants | Latin America | 0.0 /100 | #301 | Tragic 2.8% |
| Spanish Americans | 0.0 /100 | #302 | Tragic 2.8% |
| Immigrants | Honduras | 0.0 /100 | #303 | Tragic 2.8% |
| Mexican American Indians | 0.0 /100 | #304 | Tragic 2.8% |
| Hispanics or Latinos | 0.0 /100 | #305 | Tragic 2.8% |
| Immigrants | Azores | 0.0 /100 | #306 | Tragic 2.8% |
| Hopi | 0.0 /100 | #307 | Tragic 2.8% |
| Apache | 0.0 /100 | #308 | Tragic 2.8% |
| Central Americans | 0.0 /100 | #309 | Tragic 2.9% |
| Immigrants | Laos | 0.0 /100 | #310 | Tragic 2.9% |