Iranian vs Spanish Single Father Households
COMPARE
Iranian
Spanish
Single Father Households
Single Father Households Comparison
Iranians
Spanish
1.9%
SINGLE FATHER HOUSEHOLDS
100.0/ 100
METRIC RATING
19th/ 347
METRIC RANK
2.5%
SINGLE FATHER HOUSEHOLDS
1.1/ 100
METRIC RATING
258th/ 347
METRIC RANK
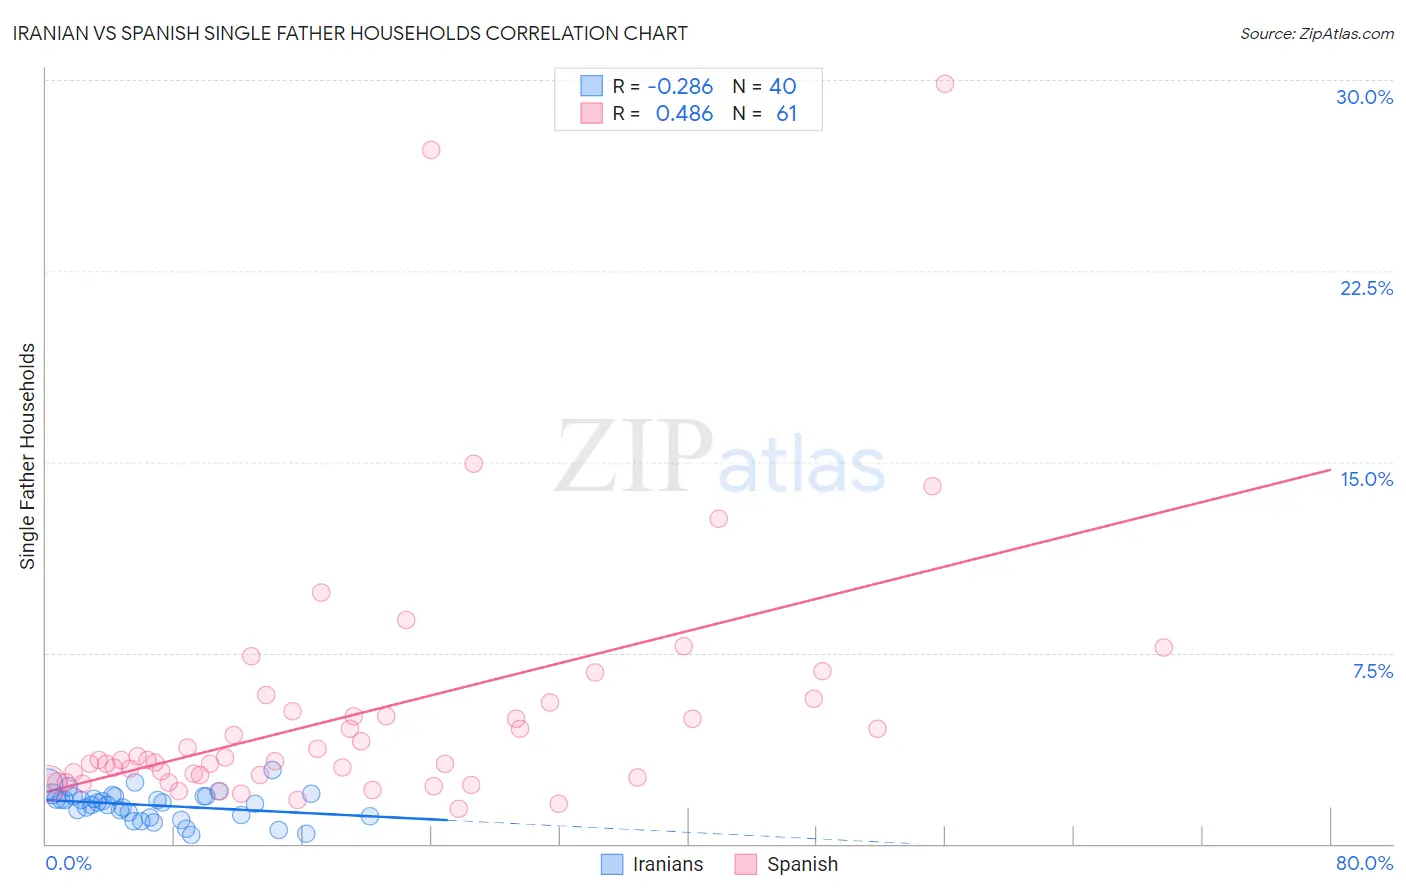
Iranian vs Spanish Single Father Households Correlation Chart
The statistical analysis conducted on geographies consisting of 314,844,289 people shows a weak negative correlation between the proportion of Iranians and percentage of single father households in the United States with a correlation coefficient (R) of -0.286 and weighted average of 1.9%. Similarly, the statistical analysis conducted on geographies consisting of 418,035,178 people shows a moderate positive correlation between the proportion of Spanish and percentage of single father households in the United States with a correlation coefficient (R) of 0.486 and weighted average of 2.5%, a difference of 31.6%.
Single Father Households Correlation Summary
| Measurement | Iranian | Spanish |
| Minimum | 0.34% | 1.4% |
| Maximum | 2.9% | 29.9% |
| Range | 2.5% | 28.5% |
| Mean | 1.5% | 5.2% |
| Median | 1.6% | 3.3% |
| Interquartile 25% (IQ1) | 1.1% | 2.6% |
| Interquartile 75% (IQ3) | 1.9% | 5.4% |
| Interquartile Range (IQR) | 0.73% | 2.7% |
| Standard Deviation (Sample) | 0.56% | 5.2% |
| Standard Deviation (Population) | 0.55% | 5.2% |
Similar Demographics by Single Father Households
Demographics Similar to Iranians by Single Father Households
In terms of single father households, the demographic groups most similar to Iranians are Thai (1.9%, a difference of 0.070%), Immigrants from Albania (1.9%, a difference of 0.37%), Immigrants from Latvia (1.9%, a difference of 0.56%), Indian (Asian) (1.9%, a difference of 0.84%), and Immigrants from India (1.9%, a difference of 1.3%).
| Demographics | Rating | Rank | Single Father Households |
| Immigrants | Greece | 100.0 /100 | #12 | Exceptional 1.9% |
| Immigrants | Singapore | 100.0 /100 | #13 | Exceptional 1.9% |
| Immigrants | Lithuania | 100.0 /100 | #14 | Exceptional 1.9% |
| Immigrants | Eastern Asia | 100.0 /100 | #15 | Exceptional 1.9% |
| Immigrants | Iran | 100.0 /100 | #16 | Exceptional 1.9% |
| Immigrants | India | 100.0 /100 | #17 | Exceptional 1.9% |
| Indians (Asian) | 100.0 /100 | #18 | Exceptional 1.9% |
| Iranians | 100.0 /100 | #19 | Exceptional 1.9% |
| Thais | 100.0 /100 | #20 | Exceptional 1.9% |
| Immigrants | Albania | 100.0 /100 | #21 | Exceptional 1.9% |
| Immigrants | Latvia | 100.0 /100 | #22 | Exceptional 1.9% |
| Immigrants | Croatia | 100.0 /100 | #23 | Exceptional 2.0% |
| Immigrants | Russia | 100.0 /100 | #24 | Exceptional 2.0% |
| Eastern Europeans | 100.0 /100 | #25 | Exceptional 2.0% |
| Assyrians/Chaldeans/Syriacs | 100.0 /100 | #26 | Exceptional 2.0% |
Demographics Similar to Spanish by Single Father Households
In terms of single father households, the demographic groups most similar to Spanish are Immigrants from Congo (2.5%, a difference of 0.090%), Comanche (2.5%, a difference of 0.16%), Immigrants from Caribbean (2.5%, a difference of 0.24%), Potawatomi (2.5%, a difference of 0.37%), and Immigrants from Belize (2.5%, a difference of 0.40%).
| Demographics | Rating | Rank | Single Father Households |
| Liberians | 2.0 /100 | #251 | Tragic 2.5% |
| Immigrants | Eritrea | 2.0 /100 | #252 | Tragic 2.5% |
| Immigrants | Somalia | 1.9 /100 | #253 | Tragic 2.5% |
| Immigrants | Thailand | 1.8 /100 | #254 | Tragic 2.5% |
| Tongans | 1.5 /100 | #255 | Tragic 2.5% |
| Potawatomi | 1.4 /100 | #256 | Tragic 2.5% |
| Immigrants | Congo | 1.2 /100 | #257 | Tragic 2.5% |
| Spanish | 1.1 /100 | #258 | Tragic 2.5% |
| Comanche | 1.0 /100 | #259 | Tragic 2.5% |
| Immigrants | Caribbean | 1.0 /100 | #260 | Tragic 2.5% |
| Immigrants | Belize | 0.9 /100 | #261 | Tragic 2.5% |
| Immigrants | Liberia | 0.8 /100 | #262 | Tragic 2.5% |
| Dominicans | 0.8 /100 | #263 | Tragic 2.5% |
| Indonesians | 0.5 /100 | #264 | Tragic 2.6% |
| Immigrants | Micronesia | 0.5 /100 | #265 | Tragic 2.6% |