Dutch West Indian vs Belizean Single Father Households
COMPARE
Dutch West Indian
Belizean
Single Father Households
Single Father Households Comparison
Dutch West Indians
Belizeans
2.6%
SINGLE FATHER HOUSEHOLDS
0.1/ 100
METRIC RATING
282nd/ 347
METRIC RANK
2.6%
SINGLE FATHER HOUSEHOLDS
0.2/ 100
METRIC RATING
272nd/ 347
METRIC RANK
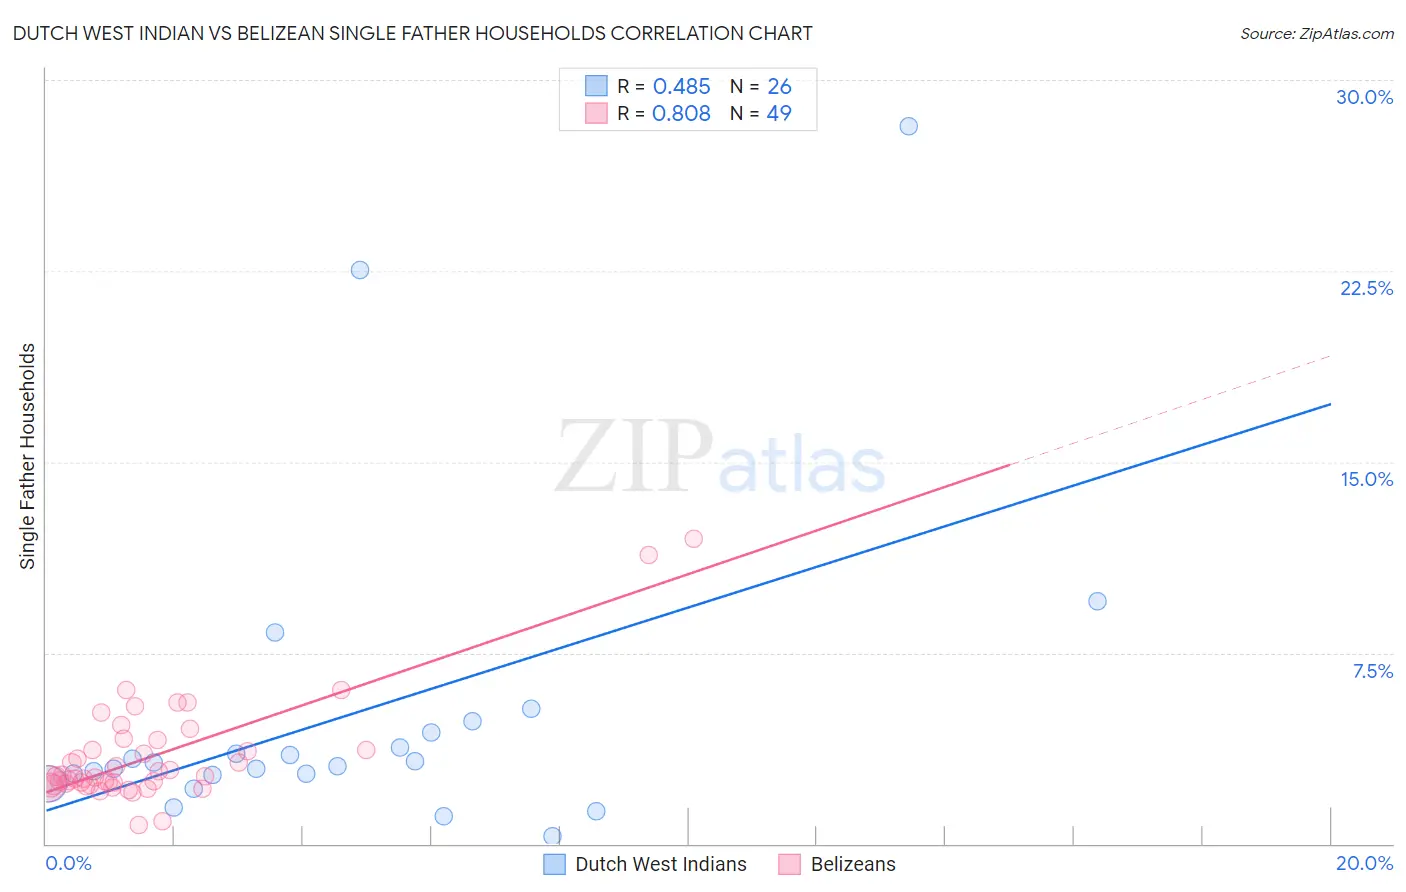
Dutch West Indian vs Belizean Single Father Households Correlation Chart
The statistical analysis conducted on geographies consisting of 85,485,397 people shows a moderate positive correlation between the proportion of Dutch West Indians and percentage of single father households in the United States with a correlation coefficient (R) of 0.485 and weighted average of 2.6%. Similarly, the statistical analysis conducted on geographies consisting of 143,901,350 people shows a very strong positive correlation between the proportion of Belizeans and percentage of single father households in the United States with a correlation coefficient (R) of 0.808 and weighted average of 2.6%, a difference of 1.4%.
Single Father Households Correlation Summary
| Measurement | Dutch West Indian | Belizean |
| Minimum | 0.30% | 0.75% |
| Maximum | 28.2% | 12.0% |
| Range | 27.9% | 11.3% |
| Mean | 5.1% | 3.4% |
| Median | 3.1% | 2.6% |
| Interquartile 25% (IQ1) | 2.7% | 2.3% |
| Interquartile 75% (IQ3) | 4.4% | 3.9% |
| Interquartile Range (IQR) | 1.6% | 1.6% |
| Standard Deviation (Sample) | 6.3% | 2.1% |
| Standard Deviation (Population) | 6.2% | 2.1% |
Demographics Similar to Dutch West Indians and Belizeans by Single Father Households
In terms of single father households, the demographic groups most similar to Dutch West Indians are Nicaraguan (2.6%, a difference of 0.050%), Immigrants from Portugal (2.6%, a difference of 0.060%), Samoan (2.6%, a difference of 0.61%), Cherokee (2.6%, a difference of 0.65%), and Immigrants from Nicaragua (2.7%, a difference of 0.69%). Similarly, the demographic groups most similar to Belizeans are Creek (2.6%, a difference of 0.0%), Iroquois (2.6%, a difference of 0.040%), Puerto Rican (2.6%, a difference of 0.070%), Seminole (2.6%, a difference of 0.37%), and Immigrants from Dominican Republic (2.6%, a difference of 0.49%).
| Demographics | Rating | Rank | Single Father Households |
| Guamanians/Chamorros | 0.4 /100 | #267 | Tragic 2.6% |
| Haitians | 0.4 /100 | #268 | Tragic 2.6% |
| Cubans | 0.3 /100 | #269 | Tragic 2.6% |
| Seminole | 0.3 /100 | #270 | Tragic 2.6% |
| Creek | 0.2 /100 | #271 | Tragic 2.6% |
| Belizeans | 0.2 /100 | #272 | Tragic 2.6% |
| Iroquois | 0.2 /100 | #273 | Tragic 2.6% |
| Puerto Ricans | 0.2 /100 | #274 | Tragic 2.6% |
| Immigrants | Dominican Republic | 0.2 /100 | #275 | Tragic 2.6% |
| Immigrants | Haiti | 0.1 /100 | #276 | Tragic 2.6% |
| Shoshone | 0.1 /100 | #277 | Tragic 2.6% |
| Cherokee | 0.1 /100 | #278 | Tragic 2.6% |
| Samoans | 0.1 /100 | #279 | Tragic 2.6% |
| Immigrants | Portugal | 0.1 /100 | #280 | Tragic 2.6% |
| Nicaraguans | 0.1 /100 | #281 | Tragic 2.6% |
| Dutch West Indians | 0.1 /100 | #282 | Tragic 2.6% |
| Immigrants | Nicaragua | 0.1 /100 | #283 | Tragic 2.7% |
| Hawaiians | 0.1 /100 | #284 | Tragic 2.7% |
| Ottawa | 0.1 /100 | #285 | Tragic 2.7% |
| Immigrants | Cuba | 0.1 /100 | #286 | Tragic 2.7% |
| Central American Indians | 0.0 /100 | #287 | Tragic 2.7% |