Iranian vs Jamaican Single Father Households
COMPARE
Iranian
Jamaican
Single Father Households
Single Father Households Comparison
Iranians
Jamaicans
1.9%
SINGLE FATHER HOUSEHOLDS
100.0/ 100
METRIC RATING
19th/ 347
METRIC RANK
2.3%
SINGLE FATHER HOUSEHOLDS
43.5/ 100
METRIC RATING
181st/ 347
METRIC RANK
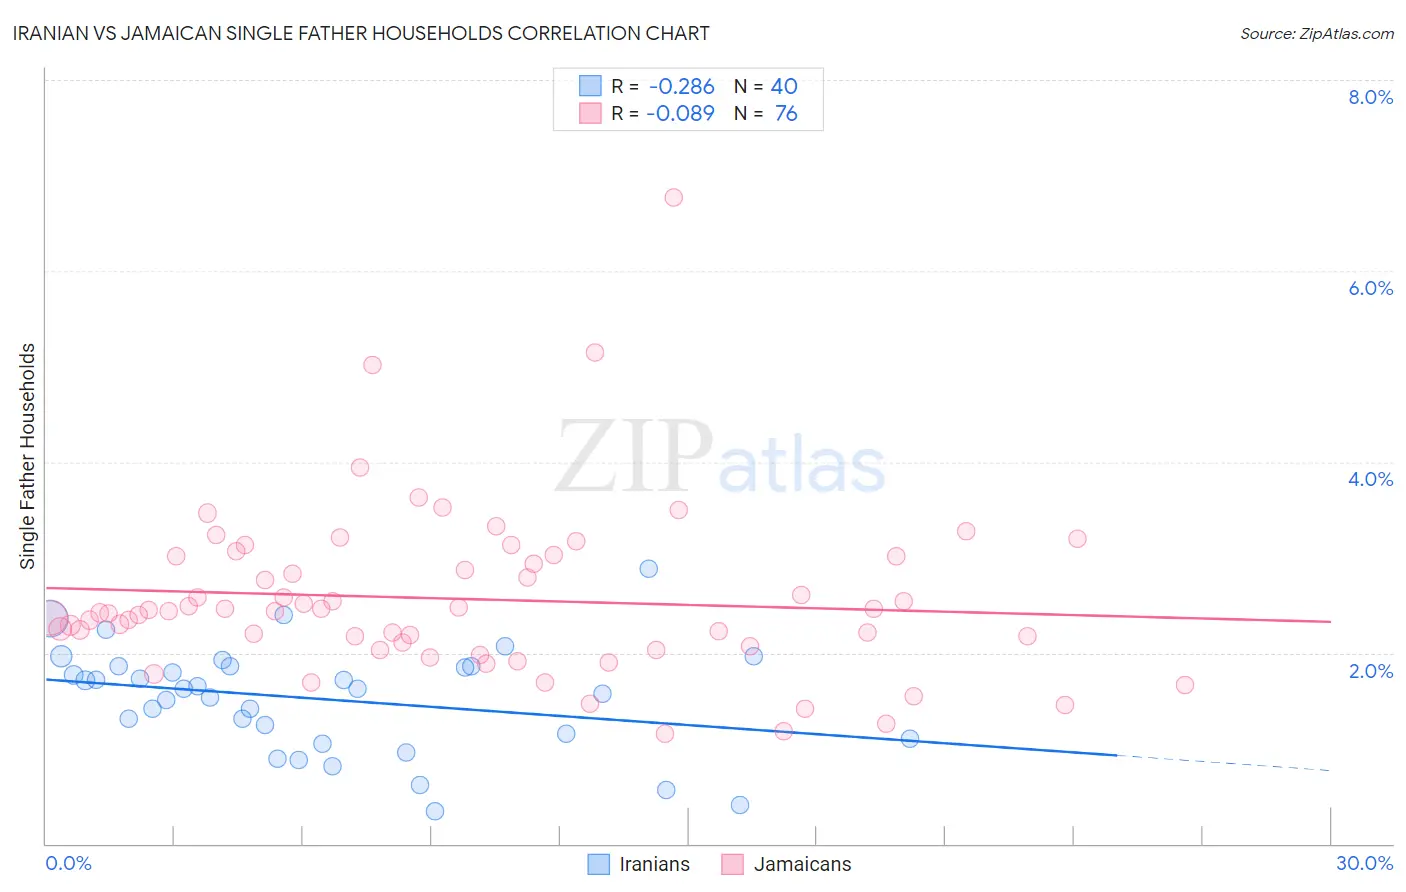
Iranian vs Jamaican Single Father Households Correlation Chart
The statistical analysis conducted on geographies consisting of 314,844,289 people shows a weak negative correlation between the proportion of Iranians and percentage of single father households in the United States with a correlation coefficient (R) of -0.286 and weighted average of 1.9%. Similarly, the statistical analysis conducted on geographies consisting of 365,117,858 people shows a slight negative correlation between the proportion of Jamaicans and percentage of single father households in the United States with a correlation coefficient (R) of -0.089 and weighted average of 2.3%, a difference of 22.2%.
Single Father Households Correlation Summary
| Measurement | Iranian | Jamaican |
| Minimum | 0.34% | 1.2% |
| Maximum | 2.9% | 6.8% |
| Range | 2.5% | 5.6% |
| Mean | 1.5% | 2.6% |
| Median | 1.6% | 2.4% |
| Interquartile 25% (IQ1) | 1.1% | 2.1% |
| Interquartile 75% (IQ3) | 1.9% | 3.0% |
| Interquartile Range (IQR) | 0.73% | 0.92% |
| Standard Deviation (Sample) | 0.56% | 0.88% |
| Standard Deviation (Population) | 0.55% | 0.88% |
Similar Demographics by Single Father Households
Demographics Similar to Iranians by Single Father Households
In terms of single father households, the demographic groups most similar to Iranians are Thai (1.9%, a difference of 0.070%), Immigrants from Albania (1.9%, a difference of 0.37%), Immigrants from Latvia (1.9%, a difference of 0.56%), Indian (Asian) (1.9%, a difference of 0.84%), and Immigrants from India (1.9%, a difference of 1.3%).
| Demographics | Rating | Rank | Single Father Households |
| Immigrants | Greece | 100.0 /100 | #12 | Exceptional 1.9% |
| Immigrants | Singapore | 100.0 /100 | #13 | Exceptional 1.9% |
| Immigrants | Lithuania | 100.0 /100 | #14 | Exceptional 1.9% |
| Immigrants | Eastern Asia | 100.0 /100 | #15 | Exceptional 1.9% |
| Immigrants | Iran | 100.0 /100 | #16 | Exceptional 1.9% |
| Immigrants | India | 100.0 /100 | #17 | Exceptional 1.9% |
| Indians (Asian) | 100.0 /100 | #18 | Exceptional 1.9% |
| Iranians | 100.0 /100 | #19 | Exceptional 1.9% |
| Thais | 100.0 /100 | #20 | Exceptional 1.9% |
| Immigrants | Albania | 100.0 /100 | #21 | Exceptional 1.9% |
| Immigrants | Latvia | 100.0 /100 | #22 | Exceptional 1.9% |
| Immigrants | Croatia | 100.0 /100 | #23 | Exceptional 2.0% |
| Immigrants | Russia | 100.0 /100 | #24 | Exceptional 2.0% |
| Eastern Europeans | 100.0 /100 | #25 | Exceptional 2.0% |
| Assyrians/Chaldeans/Syriacs | 100.0 /100 | #26 | Exceptional 2.0% |
Demographics Similar to Jamaicans by Single Father Households
In terms of single father households, the demographic groups most similar to Jamaicans are Belgian (2.3%, a difference of 0.020%), Yugoslavian (2.3%, a difference of 0.030%), Costa Rican (2.3%, a difference of 0.040%), Welsh (2.3%, a difference of 0.040%), and Immigrants from Panama (2.4%, a difference of 0.12%).
| Demographics | Rating | Rank | Single Father Households |
| Afghans | 50.0 /100 | #174 | Average 2.3% |
| Immigrants | Jamaica | 49.1 /100 | #175 | Average 2.3% |
| Danes | 48.2 /100 | #176 | Average 2.3% |
| Colombians | 48.0 /100 | #177 | Average 2.3% |
| Costa Ricans | 44.1 /100 | #178 | Average 2.3% |
| Welsh | 44.0 /100 | #179 | Average 2.3% |
| Yugoslavians | 43.9 /100 | #180 | Average 2.3% |
| Jamaicans | 43.5 /100 | #181 | Average 2.3% |
| Belgians | 43.3 /100 | #182 | Average 2.3% |
| Immigrants | Panama | 41.8 /100 | #183 | Average 2.4% |
| Sri Lankans | 41.8 /100 | #184 | Average 2.4% |
| Nigerians | 41.0 /100 | #185 | Average 2.4% |
| Immigrants | Bosnia and Herzegovina | 40.4 /100 | #186 | Average 2.4% |
| Immigrants | Colombia | 34.0 /100 | #187 | Fair 2.4% |
| Hmong | 33.0 /100 | #188 | Fair 2.4% |