Sierra Leonean vs Belizean Single Father Households
COMPARE
Sierra Leonean
Belizean
Single Father Households
Single Father Households Comparison
Sierra Leoneans
Belizeans
2.5%
SINGLE FATHER HOUSEHOLDS
5.9/ 100
METRIC RATING
237th/ 347
METRIC RANK
2.6%
SINGLE FATHER HOUSEHOLDS
0.2/ 100
METRIC RATING
272nd/ 347
METRIC RANK
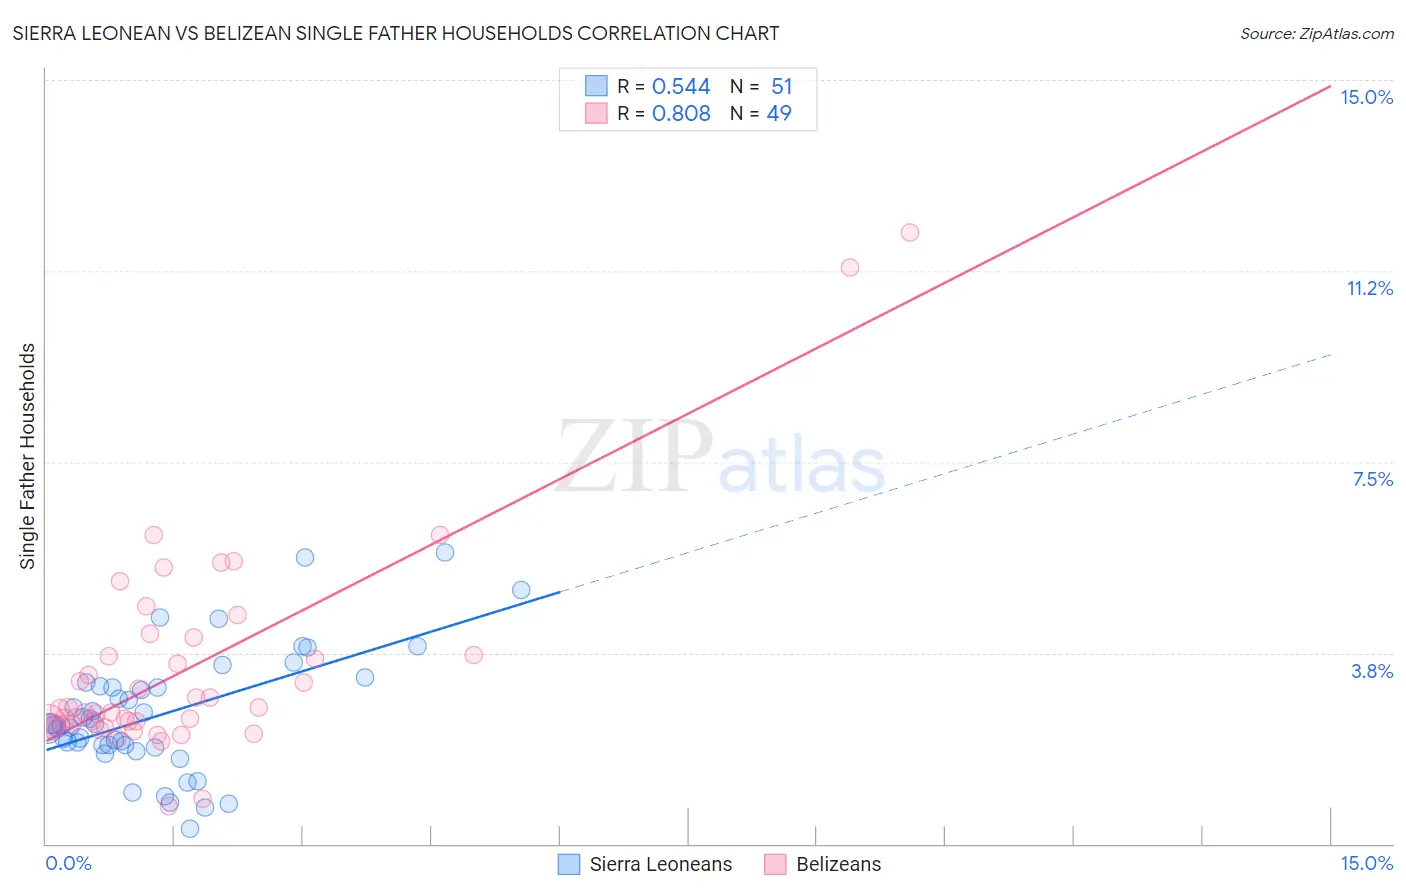
Sierra Leonean vs Belizean Single Father Households Correlation Chart
The statistical analysis conducted on geographies consisting of 83,228,063 people shows a substantial positive correlation between the proportion of Sierra Leoneans and percentage of single father households in the United States with a correlation coefficient (R) of 0.544 and weighted average of 2.5%. Similarly, the statistical analysis conducted on geographies consisting of 143,901,350 people shows a very strong positive correlation between the proportion of Belizeans and percentage of single father households in the United States with a correlation coefficient (R) of 0.808 and weighted average of 2.6%, a difference of 5.9%.
Single Father Households Correlation Summary
| Measurement | Sierra Leonean | Belizean |
| Minimum | 0.29% | 0.75% |
| Maximum | 5.7% | 12.0% |
| Range | 5.4% | 11.3% |
| Mean | 2.5% | 3.4% |
| Median | 2.3% | 2.6% |
| Interquartile 25% (IQ1) | 1.9% | 2.3% |
| Interquartile 75% (IQ3) | 3.1% | 3.9% |
| Interquartile Range (IQR) | 1.2% | 1.6% |
| Standard Deviation (Sample) | 1.2% | 2.1% |
| Standard Deviation (Population) | 1.2% | 2.1% |
Similar Demographics by Single Father Households
Demographics Similar to Sierra Leoneans by Single Father Households
In terms of single father households, the demographic groups most similar to Sierra Leoneans are Immigrants from Sierra Leone (2.5%, a difference of 0.030%), Immigrants from Oceania (2.5%, a difference of 0.040%), Cajun (2.5%, a difference of 0.050%), Immigrants (2.5%, a difference of 0.10%), and African (2.5%, a difference of 0.12%).
| Demographics | Rating | Rank | Single Father Households |
| Sub-Saharan Africans | 8.3 /100 | #230 | Tragic 2.4% |
| Immigrants | Nonimmigrants | 7.6 /100 | #231 | Tragic 2.4% |
| Pennsylvania Germans | 7.3 /100 | #232 | Tragic 2.4% |
| Immigrants | Western Africa | 7.0 /100 | #233 | Tragic 2.4% |
| Africans | 6.3 /100 | #234 | Tragic 2.5% |
| Immigrants | Immigrants | 6.3 /100 | #235 | Tragic 2.5% |
| Cajuns | 6.1 /100 | #236 | Tragic 2.5% |
| Sierra Leoneans | 5.9 /100 | #237 | Tragic 2.5% |
| Immigrants | Sierra Leone | 5.8 /100 | #238 | Tragic 2.5% |
| Immigrants | Oceania | 5.8 /100 | #239 | Tragic 2.5% |
| Immigrants | Dominica | 4.8 /100 | #240 | Tragic 2.5% |
| Portuguese | 4.1 /100 | #241 | Tragic 2.5% |
| Osage | 4.1 /100 | #242 | Tragic 2.5% |
| Spaniards | 3.1 /100 | #243 | Tragic 2.5% |
| Immigrants | Middle Africa | 2.8 /100 | #244 | Tragic 2.5% |
Demographics Similar to Belizeans by Single Father Households
In terms of single father households, the demographic groups most similar to Belizeans are Creek (2.6%, a difference of 0.0%), Iroquois (2.6%, a difference of 0.040%), Puerto Rican (2.6%, a difference of 0.070%), Seminole (2.6%, a difference of 0.37%), and Immigrants from Dominican Republic (2.6%, a difference of 0.49%).
| Demographics | Rating | Rank | Single Father Households |
| Immigrants | Micronesia | 0.5 /100 | #265 | Tragic 2.6% |
| French American Indians | 0.5 /100 | #266 | Tragic 2.6% |
| Guamanians/Chamorros | 0.4 /100 | #267 | Tragic 2.6% |
| Haitians | 0.4 /100 | #268 | Tragic 2.6% |
| Cubans | 0.3 /100 | #269 | Tragic 2.6% |
| Seminole | 0.3 /100 | #270 | Tragic 2.6% |
| Creek | 0.2 /100 | #271 | Tragic 2.6% |
| Belizeans | 0.2 /100 | #272 | Tragic 2.6% |
| Iroquois | 0.2 /100 | #273 | Tragic 2.6% |
| Puerto Ricans | 0.2 /100 | #274 | Tragic 2.6% |
| Immigrants | Dominican Republic | 0.2 /100 | #275 | Tragic 2.6% |
| Immigrants | Haiti | 0.1 /100 | #276 | Tragic 2.6% |
| Shoshone | 0.1 /100 | #277 | Tragic 2.6% |
| Cherokee | 0.1 /100 | #278 | Tragic 2.6% |
| Samoans | 0.1 /100 | #279 | Tragic 2.6% |