Indonesian vs Immigrants from Switzerland In Labor Force | Age 20-24
COMPARE
Indonesian
Immigrants from Switzerland
In Labor Force | Age 20-24
In Labor Force | Age 20-24 Comparison
Indonesians
Immigrants from Switzerland
77.2%
IN LABOR FORCE | AGE 20-24
100.0/ 100
METRIC RATING
52nd/ 347
METRIC RANK
74.2%
IN LABOR FORCE | AGE 20-24
4.1/ 100
METRIC RATING
232nd/ 347
METRIC RANK
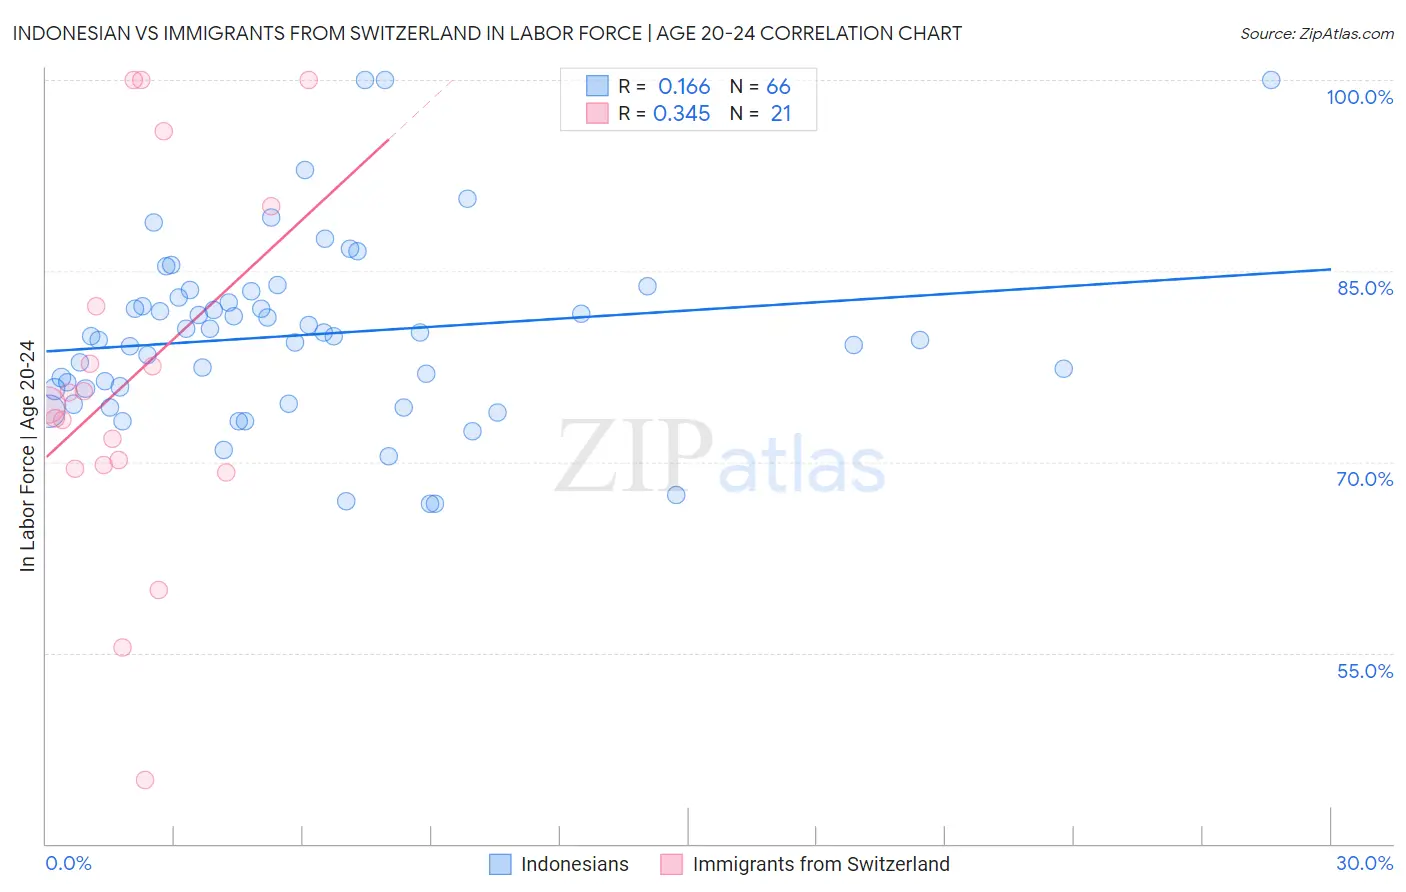
Indonesian vs Immigrants from Switzerland In Labor Force | Age 20-24 Correlation Chart
The statistical analysis conducted on geographies consisting of 162,737,934 people shows a poor positive correlation between the proportion of Indonesians and labor force participation rate among population between the ages 20 and 24 in the United States with a correlation coefficient (R) of 0.166 and weighted average of 77.2%. Similarly, the statistical analysis conducted on geographies consisting of 148,049,599 people shows a mild positive correlation between the proportion of Immigrants from Switzerland and labor force participation rate among population between the ages 20 and 24 in the United States with a correlation coefficient (R) of 0.345 and weighted average of 74.2%, a difference of 4.1%.
In Labor Force | Age 20-24 Correlation Summary
| Measurement | Indonesian | Immigrants from Switzerland |
| Minimum | 66.7% | 45.0% |
| Maximum | 100.0% | 100.0% |
| Range | 33.3% | 55.0% |
| Mean | 80.0% | 76.5% |
| Median | 79.9% | 74.4% |
| Interquartile 25% (IQ1) | 75.7% | 69.6% |
| Interquartile 75% (IQ3) | 82.9% | 86.1% |
| Interquartile Range (IQR) | 7.2% | 16.5% |
| Standard Deviation (Sample) | 7.1% | 14.5% |
| Standard Deviation (Population) | 7.1% | 14.1% |
Similar Demographics by In Labor Force | Age 20-24
Demographics Similar to Indonesians by In Labor Force | Age 20-24
In terms of in labor force | age 20-24, the demographic groups most similar to Indonesians are Croatian (77.2%, a difference of 0.010%), Immigrants from the Azores (77.2%, a difference of 0.010%), Malaysian (77.2%, a difference of 0.020%), Serbian (77.3%, a difference of 0.060%), and Chinese (77.3%, a difference of 0.060%).
| Demographics | Rating | Rank | In Labor Force | Age 20-24 |
| Native Hawaiians | 100.0 /100 | #45 | Exceptional 77.4% |
| Samoans | 100.0 /100 | #46 | Exceptional 77.4% |
| Ethiopians | 100.0 /100 | #47 | Exceptional 77.3% |
| Serbians | 100.0 /100 | #48 | Exceptional 77.3% |
| Chinese | 100.0 /100 | #49 | Exceptional 77.3% |
| Malaysians | 100.0 /100 | #50 | Exceptional 77.2% |
| Croatians | 100.0 /100 | #51 | Exceptional 77.2% |
| Indonesians | 100.0 /100 | #52 | Exceptional 77.2% |
| Immigrants | Azores | 100.0 /100 | #53 | Exceptional 77.2% |
| Celtics | 99.9 /100 | #54 | Exceptional 77.1% |
| Immigrants | Liberia | 99.9 /100 | #55 | Exceptional 77.1% |
| Europeans | 99.9 /100 | #56 | Exceptional 77.1% |
| Chippewa | 99.9 /100 | #57 | Exceptional 77.1% |
| Hawaiians | 99.9 /100 | #58 | Exceptional 77.0% |
| Scotch-Irish | 99.9 /100 | #59 | Exceptional 77.0% |
Demographics Similar to Immigrants from Switzerland by In Labor Force | Age 20-24
In terms of in labor force | age 20-24, the demographic groups most similar to Immigrants from Switzerland are Immigrants from Greece (74.2%, a difference of 0.010%), Immigrants from Albania (74.2%, a difference of 0.020%), Immigrants from Chile (74.1%, a difference of 0.040%), Immigrants from Sweden (74.2%, a difference of 0.050%), and Immigrants (74.1%, a difference of 0.050%).
| Demographics | Rating | Rank | In Labor Force | Age 20-24 |
| Ghanaians | 6.2 /100 | #225 | Tragic 74.3% |
| Immigrants | Fiji | 5.9 /100 | #226 | Tragic 74.3% |
| Immigrants | Ireland | 5.8 /100 | #227 | Tragic 74.3% |
| Immigrants | Ukraine | 5.1 /100 | #228 | Tragic 74.2% |
| Immigrants | Sweden | 4.6 /100 | #229 | Tragic 74.2% |
| Immigrants | Albania | 4.3 /100 | #230 | Tragic 74.2% |
| Immigrants | Greece | 4.1 /100 | #231 | Tragic 74.2% |
| Immigrants | Switzerland | 4.1 /100 | #232 | Tragic 74.2% |
| Immigrants | Chile | 3.7 /100 | #233 | Tragic 74.1% |
| Immigrants | Immigrants | 3.6 /100 | #234 | Tragic 74.1% |
| Laotians | 3.5 /100 | #235 | Tragic 74.1% |
| Immigrants | France | 3.3 /100 | #236 | Tragic 74.1% |
| Bermudans | 3.2 /100 | #237 | Tragic 74.1% |
| Immigrants | Japan | 3.0 /100 | #238 | Tragic 74.1% |
| Immigrants | Latin America | 2.7 /100 | #239 | Tragic 74.1% |