Indonesian vs Immigrants from Egypt Average Family Size
COMPARE
Indonesian
Immigrants from Egypt
Average Family Size
Average Family Size Comparison
Indonesians
Immigrants from Egypt
3.28
AVERAGE FAMILY SIZE
96.2/ 100
METRIC RATING
111th/ 347
METRIC RANK
3.24
AVERAGE FAMILY SIZE
70.0/ 100
METRIC RATING
154th/ 347
METRIC RANK
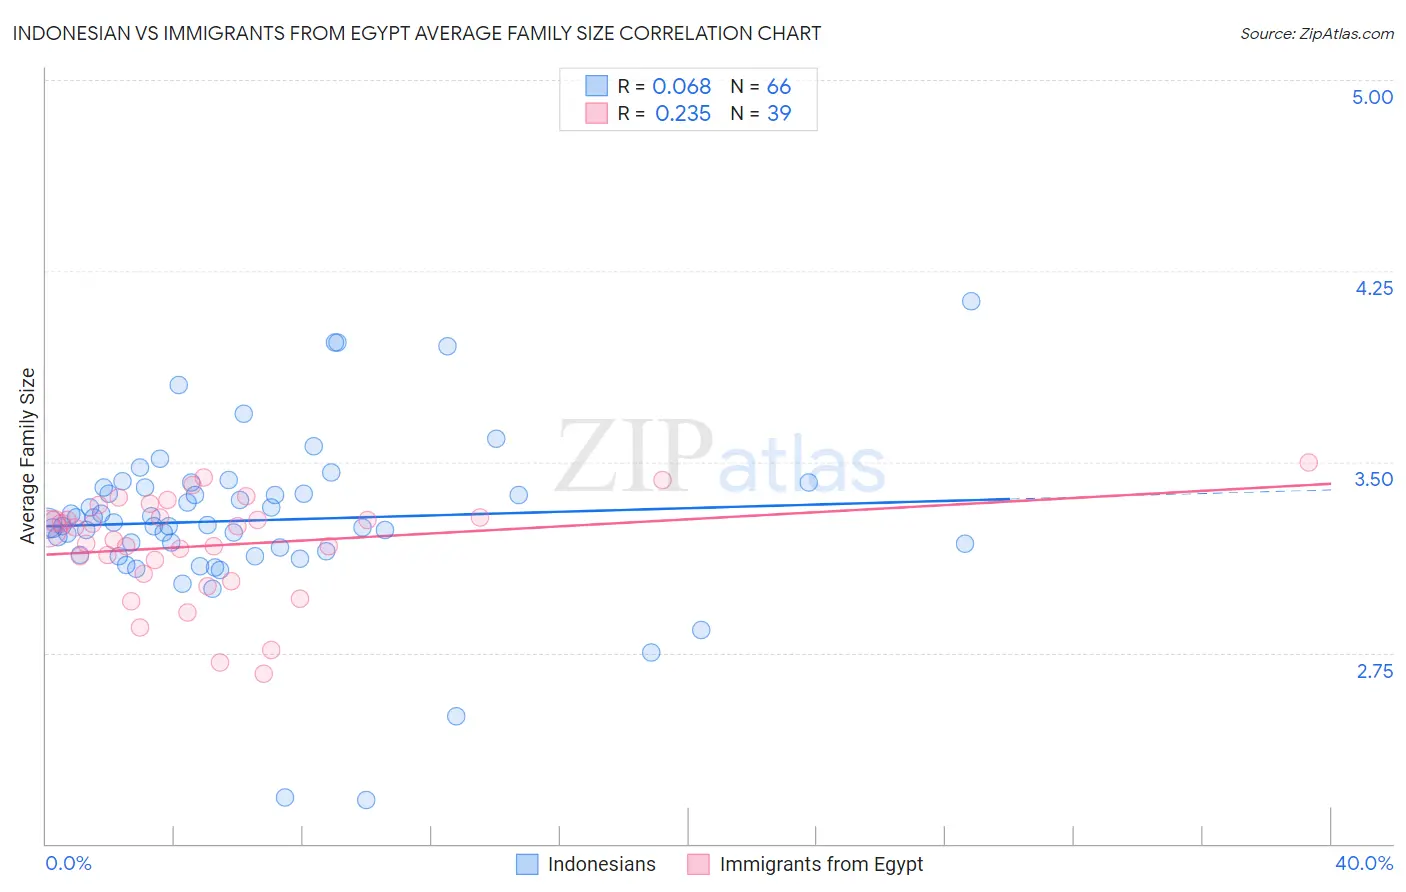
Indonesian vs Immigrants from Egypt Average Family Size Correlation Chart
The statistical analysis conducted on geographies consisting of 162,608,656 people shows a slight positive correlation between the proportion of Indonesians and average family size in the United States with a correlation coefficient (R) of 0.068 and weighted average of 3.28. Similarly, the statistical analysis conducted on geographies consisting of 245,429,769 people shows a weak positive correlation between the proportion of Immigrants from Egypt and average family size in the United States with a correlation coefficient (R) of 0.235 and weighted average of 3.24, a difference of 1.1%.
Average Family Size Correlation Summary
| Measurement | Indonesian | Immigrants from Egypt |
| Minimum | 2.17 | 2.67 |
| Maximum | 4.13 | 3.50 |
| Range | 1.96 | 0.83 |
| Mean | 3.27 | 3.17 |
| Median | 3.25 | 3.24 |
| Interquartile 25% (IQ1) | 3.15 | 3.06 |
| Interquartile 75% (IQ3) | 3.40 | 3.28 |
| Interquartile Range (IQR) | 0.25 | 0.22 |
| Standard Deviation (Sample) | 0.33 | 0.20 |
| Standard Deviation (Population) | 0.33 | 0.20 |
Similar Demographics by Average Family Size
Demographics Similar to Indonesians by Average Family Size
In terms of average family size, the demographic groups most similar to Indonesians are Bahamian (3.28, a difference of 0.050%), Puerto Rican (3.28, a difference of 0.060%), Black/African American (3.27, a difference of 0.060%), Immigrants from Panama (3.27, a difference of 0.070%), and Asian (3.28, a difference of 0.11%).
| Demographics | Rating | Rank | Average Family Size |
| Bolivians | 98.3 /100 | #104 | Exceptional 3.29 |
| Immigrants | Ghana | 98.1 /100 | #105 | Exceptional 3.29 |
| Paiute | 98.0 /100 | #106 | Exceptional 3.29 |
| Ghanaians | 98.0 /100 | #107 | Exceptional 3.29 |
| Asians | 97.0 /100 | #108 | Exceptional 3.28 |
| Puerto Ricans | 96.7 /100 | #109 | Exceptional 3.28 |
| Bahamians | 96.6 /100 | #110 | Exceptional 3.28 |
| Indonesians | 96.2 /100 | #111 | Exceptional 3.28 |
| Blacks/African Americans | 95.7 /100 | #112 | Exceptional 3.27 |
| Immigrants | Panama | 95.6 /100 | #113 | Exceptional 3.27 |
| South Americans | 95.1 /100 | #114 | Exceptional 3.27 |
| Immigrants | Liberia | 95.0 /100 | #115 | Exceptional 3.27 |
| Immigrants | South America | 95.0 /100 | #116 | Exceptional 3.27 |
| Kiowa | 94.8 /100 | #117 | Exceptional 3.27 |
| Immigrants | Asia | 94.0 /100 | #118 | Exceptional 3.27 |
Demographics Similar to Immigrants from Egypt by Average Family Size
In terms of average family size, the demographic groups most similar to Immigrants from Egypt are Immigrants from Eritrea (3.24, a difference of 0.030%), Seminole (3.24, a difference of 0.040%), Immigrants from Taiwan (3.24, a difference of 0.040%), Spanish American (3.24, a difference of 0.060%), and Immigrants from Uzbekistan (3.24, a difference of 0.060%).
| Demographics | Rating | Rank | Average Family Size |
| Immigrants | Jordan | 75.7 /100 | #147 | Good 3.24 |
| Blackfeet | 75.0 /100 | #148 | Good 3.24 |
| Assyrians/Chaldeans/Syriacs | 73.8 /100 | #149 | Good 3.24 |
| Indians (Asian) | 73.6 /100 | #150 | Good 3.24 |
| Jordanians | 73.5 /100 | #151 | Good 3.24 |
| Spanish Americans | 72.5 /100 | #152 | Good 3.24 |
| Immigrants | Eritrea | 71.4 /100 | #153 | Good 3.24 |
| Immigrants | Egypt | 70.0 /100 | #154 | Good 3.24 |
| Seminole | 68.2 /100 | #155 | Good 3.24 |
| Immigrants | Taiwan | 68.1 /100 | #156 | Good 3.24 |
| Immigrants | Uzbekistan | 67.0 /100 | #157 | Good 3.24 |
| Iraqis | 64.3 /100 | #158 | Good 3.24 |
| Ethiopians | 63.9 /100 | #159 | Good 3.24 |
| Immigrants | Iraq | 63.7 /100 | #160 | Good 3.24 |
| Immigrants | Chile | 63.2 /100 | #161 | Good 3.24 |