Indonesian vs Immigrants from Zimbabwe Average Family Size
COMPARE
Indonesian
Immigrants from Zimbabwe
Average Family Size
Average Family Size Comparison
Indonesians
Immigrants from Zimbabwe
3.28
AVERAGE FAMILY SIZE
96.2/ 100
METRIC RATING
111th/ 347
METRIC RANK
3.19
AVERAGE FAMILY SIZE
7.1/ 100
METRIC RATING
223rd/ 347
METRIC RANK
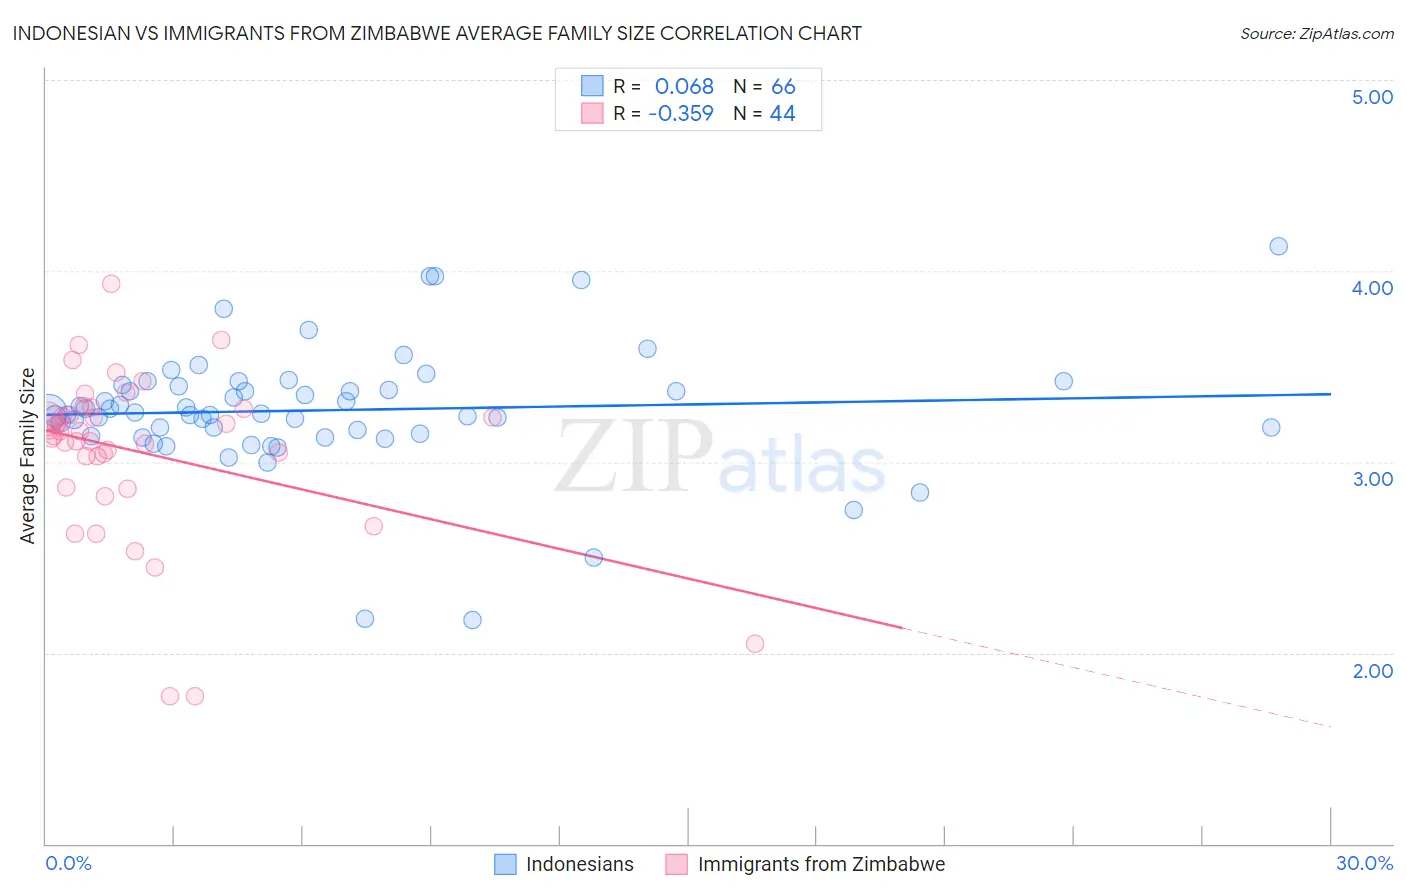
Indonesian vs Immigrants from Zimbabwe Average Family Size Correlation Chart
The statistical analysis conducted on geographies consisting of 162,608,656 people shows a slight positive correlation between the proportion of Indonesians and average family size in the United States with a correlation coefficient (R) of 0.068 and weighted average of 3.28. Similarly, the statistical analysis conducted on geographies consisting of 117,791,116 people shows a mild negative correlation between the proportion of Immigrants from Zimbabwe and average family size in the United States with a correlation coefficient (R) of -0.359 and weighted average of 3.19, a difference of 2.7%.
Average Family Size Correlation Summary
| Measurement | Indonesian | Immigrants from Zimbabwe |
| Minimum | 2.17 | 1.77 |
| Maximum | 4.13 | 3.93 |
| Range | 1.96 | 2.16 |
| Mean | 3.27 | 3.05 |
| Median | 3.25 | 3.15 |
| Interquartile 25% (IQ1) | 3.15 | 2.95 |
| Interquartile 75% (IQ3) | 3.40 | 3.26 |
| Interquartile Range (IQR) | 0.25 | 0.31 |
| Standard Deviation (Sample) | 0.33 | 0.44 |
| Standard Deviation (Population) | 0.33 | 0.43 |
Similar Demographics by Average Family Size
Demographics Similar to Indonesians by Average Family Size
In terms of average family size, the demographic groups most similar to Indonesians are Bahamian (3.28, a difference of 0.050%), Puerto Rican (3.28, a difference of 0.060%), Black/African American (3.27, a difference of 0.060%), Immigrants from Panama (3.27, a difference of 0.070%), and Asian (3.28, a difference of 0.11%).
| Demographics | Rating | Rank | Average Family Size |
| Bolivians | 98.3 /100 | #104 | Exceptional 3.29 |
| Immigrants | Ghana | 98.1 /100 | #105 | Exceptional 3.29 |
| Paiute | 98.0 /100 | #106 | Exceptional 3.29 |
| Ghanaians | 98.0 /100 | #107 | Exceptional 3.29 |
| Asians | 97.0 /100 | #108 | Exceptional 3.28 |
| Puerto Ricans | 96.7 /100 | #109 | Exceptional 3.28 |
| Bahamians | 96.6 /100 | #110 | Exceptional 3.28 |
| Indonesians | 96.2 /100 | #111 | Exceptional 3.28 |
| Blacks/African Americans | 95.7 /100 | #112 | Exceptional 3.27 |
| Immigrants | Panama | 95.6 /100 | #113 | Exceptional 3.27 |
| South Americans | 95.1 /100 | #114 | Exceptional 3.27 |
| Immigrants | Liberia | 95.0 /100 | #115 | Exceptional 3.27 |
| Immigrants | South America | 95.0 /100 | #116 | Exceptional 3.27 |
| Kiowa | 94.8 /100 | #117 | Exceptional 3.27 |
| Immigrants | Asia | 94.0 /100 | #118 | Exceptional 3.27 |
Demographics Similar to Immigrants from Zimbabwe by Average Family Size
In terms of average family size, the demographic groups most similar to Immigrants from Zimbabwe are Immigrants from Ukraine (3.19, a difference of 0.010%), Immigrants from Kuwait (3.19, a difference of 0.010%), Syrian (3.19, a difference of 0.040%), Cree (3.19, a difference of 0.060%), and Chickasaw (3.19, a difference of 0.080%).
| Demographics | Rating | Rank | Average Family Size |
| Bermudans | 11.0 /100 | #216 | Poor 3.20 |
| Immigrants | Somalia | 10.3 /100 | #217 | Poor 3.20 |
| French American Indians | 9.8 /100 | #218 | Tragic 3.20 |
| Pennsylvania Germans | 9.3 /100 | #219 | Tragic 3.19 |
| Lebanese | 9.1 /100 | #220 | Tragic 3.19 |
| Immigrants | Ukraine | 7.2 /100 | #221 | Tragic 3.19 |
| Immigrants | Kuwait | 7.2 /100 | #222 | Tragic 3.19 |
| Immigrants | Zimbabwe | 7.1 /100 | #223 | Tragic 3.19 |
| Syrians | 6.5 /100 | #224 | Tragic 3.19 |
| Cree | 6.2 /100 | #225 | Tragic 3.19 |
| Chickasaw | 6.0 /100 | #226 | Tragic 3.19 |
| Portuguese | 6.0 /100 | #227 | Tragic 3.19 |
| Immigrants | Nonimmigrants | 5.7 /100 | #228 | Tragic 3.19 |
| Immigrants | Italy | 5.3 /100 | #229 | Tragic 3.19 |
| Icelanders | 5.2 /100 | #230 | Tragic 3.19 |