Indonesian vs Ecuadorian Average Family Size
COMPARE
Indonesian
Ecuadorian
Average Family Size
Average Family Size Comparison
Indonesians
Ecuadorians
3.28
AVERAGE FAMILY SIZE
96.2/ 100
METRIC RATING
111th/ 347
METRIC RANK
3.32
AVERAGE FAMILY SIZE
99.8/ 100
METRIC RATING
82nd/ 347
METRIC RANK
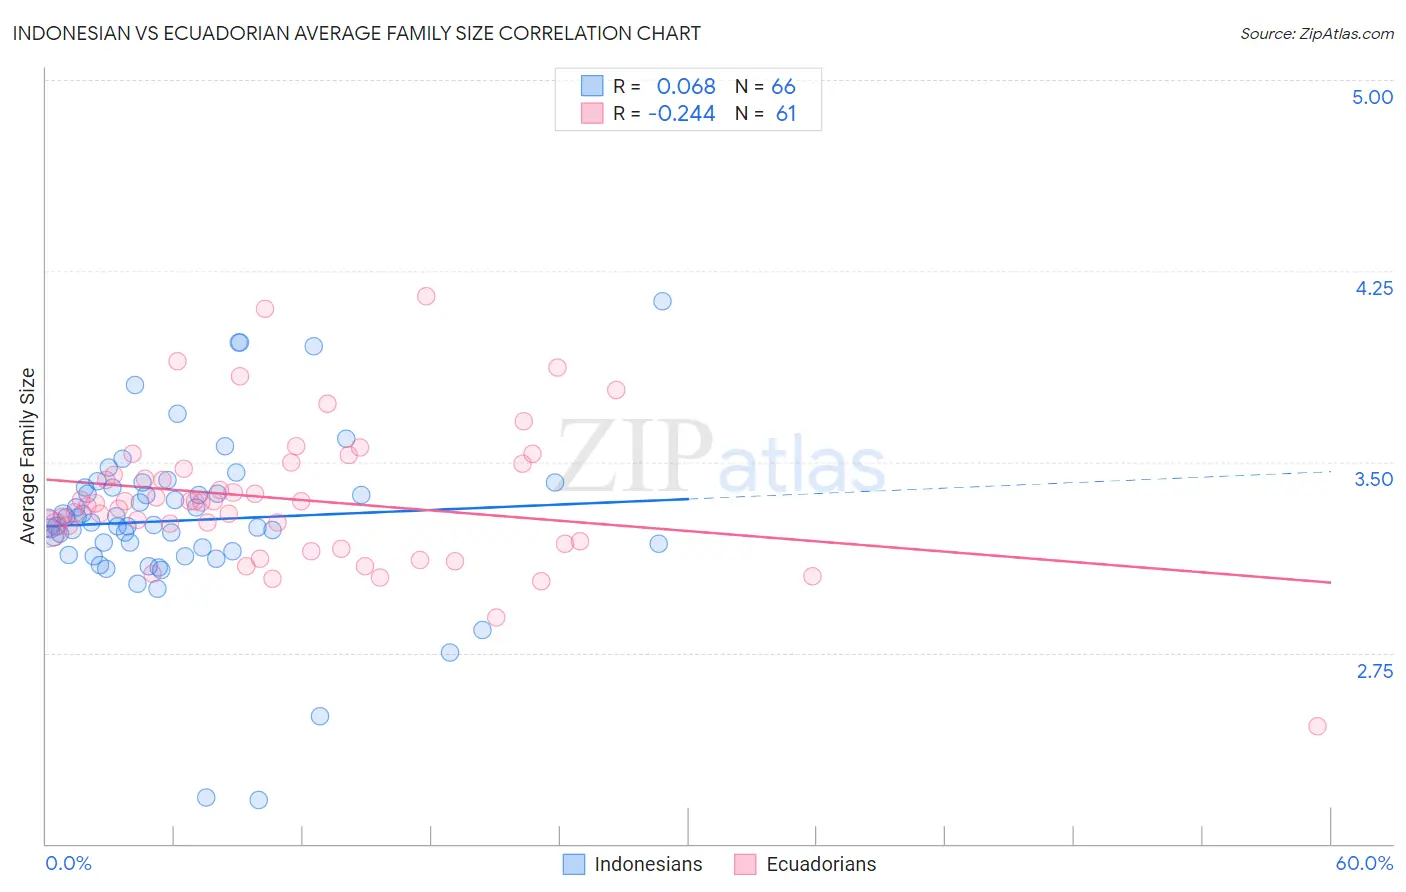
Indonesian vs Ecuadorian Average Family Size Correlation Chart
The statistical analysis conducted on geographies consisting of 162,608,656 people shows a slight positive correlation between the proportion of Indonesians and average family size in the United States with a correlation coefficient (R) of 0.068 and weighted average of 3.28. Similarly, the statistical analysis conducted on geographies consisting of 317,647,749 people shows a weak negative correlation between the proportion of Ecuadorians and average family size in the United States with a correlation coefficient (R) of -0.244 and weighted average of 3.32, a difference of 1.3%.
Average Family Size Correlation Summary
| Measurement | Indonesian | Ecuadorian |
| Minimum | 2.17 | 2.46 |
| Maximum | 4.13 | 4.15 |
| Range | 1.96 | 1.69 |
| Mean | 3.27 | 3.35 |
| Median | 3.25 | 3.34 |
| Interquartile 25% (IQ1) | 3.15 | 3.19 |
| Interquartile 75% (IQ3) | 3.40 | 3.48 |
| Interquartile Range (IQR) | 0.25 | 0.30 |
| Standard Deviation (Sample) | 0.33 | 0.28 |
| Standard Deviation (Population) | 0.33 | 0.28 |
Similar Demographics by Average Family Size
Demographics Similar to Indonesians by Average Family Size
In terms of average family size, the demographic groups most similar to Indonesians are Bahamian (3.28, a difference of 0.050%), Puerto Rican (3.28, a difference of 0.060%), Black/African American (3.27, a difference of 0.060%), Immigrants from Panama (3.27, a difference of 0.070%), and Asian (3.28, a difference of 0.11%).
| Demographics | Rating | Rank | Average Family Size |
| Bolivians | 98.3 /100 | #104 | Exceptional 3.29 |
| Immigrants | Ghana | 98.1 /100 | #105 | Exceptional 3.29 |
| Paiute | 98.0 /100 | #106 | Exceptional 3.29 |
| Ghanaians | 98.0 /100 | #107 | Exceptional 3.29 |
| Asians | 97.0 /100 | #108 | Exceptional 3.28 |
| Puerto Ricans | 96.7 /100 | #109 | Exceptional 3.28 |
| Bahamians | 96.6 /100 | #110 | Exceptional 3.28 |
| Indonesians | 96.2 /100 | #111 | Exceptional 3.28 |
| Blacks/African Americans | 95.7 /100 | #112 | Exceptional 3.27 |
| Immigrants | Panama | 95.6 /100 | #113 | Exceptional 3.27 |
| South Americans | 95.1 /100 | #114 | Exceptional 3.27 |
| Immigrants | Liberia | 95.0 /100 | #115 | Exceptional 3.27 |
| Immigrants | South America | 95.0 /100 | #116 | Exceptional 3.27 |
| Kiowa | 94.8 /100 | #117 | Exceptional 3.27 |
| Immigrants | Asia | 94.0 /100 | #118 | Exceptional 3.27 |
Demographics Similar to Ecuadorians by Average Family Size
In terms of average family size, the demographic groups most similar to Ecuadorians are Immigrants from Afghanistan (3.32, a difference of 0.010%), Immigrants from Dominica (3.32, a difference of 0.040%), Immigrants from Nigeria (3.32, a difference of 0.050%), Lumbee (3.32, a difference of 0.080%), and Afghan (3.31, a difference of 0.090%).
| Demographics | Rating | Rank | Average Family Size |
| Immigrants | Barbados | 99.8 /100 | #75 | Exceptional 3.32 |
| Trinidadians and Tobagonians | 99.8 /100 | #76 | Exceptional 3.32 |
| Immigrants | Ecuador | 99.8 /100 | #77 | Exceptional 3.32 |
| Immigrants | Micronesia | 99.8 /100 | #78 | Exceptional 3.32 |
| British West Indians | 99.8 /100 | #79 | Exceptional 3.32 |
| Lumbee | 99.8 /100 | #80 | Exceptional 3.32 |
| Immigrants | Dominica | 99.8 /100 | #81 | Exceptional 3.32 |
| Ecuadorians | 99.8 /100 | #82 | Exceptional 3.32 |
| Immigrants | Afghanistan | 99.8 /100 | #83 | Exceptional 3.32 |
| Immigrants | Nigeria | 99.7 /100 | #84 | Exceptional 3.32 |
| Afghans | 99.7 /100 | #85 | Exceptional 3.31 |
| Jamaicans | 99.7 /100 | #86 | Exceptional 3.31 |
| Immigrants | Peru | 99.7 /100 | #87 | Exceptional 3.31 |
| Immigrants | Bolivia | 99.6 /100 | #88 | Exceptional 3.31 |
| Malaysians | 99.6 /100 | #89 | Exceptional 3.31 |