Indonesian vs Immigrants from Romania Average Family Size
COMPARE
Indonesian
Immigrants from Romania
Average Family Size
Average Family Size Comparison
Indonesians
Immigrants from Romania
3.28
AVERAGE FAMILY SIZE
96.2/ 100
METRIC RATING
111th/ 347
METRIC RANK
3.18
AVERAGE FAMILY SIZE
3.7/ 100
METRIC RATING
237th/ 347
METRIC RANK
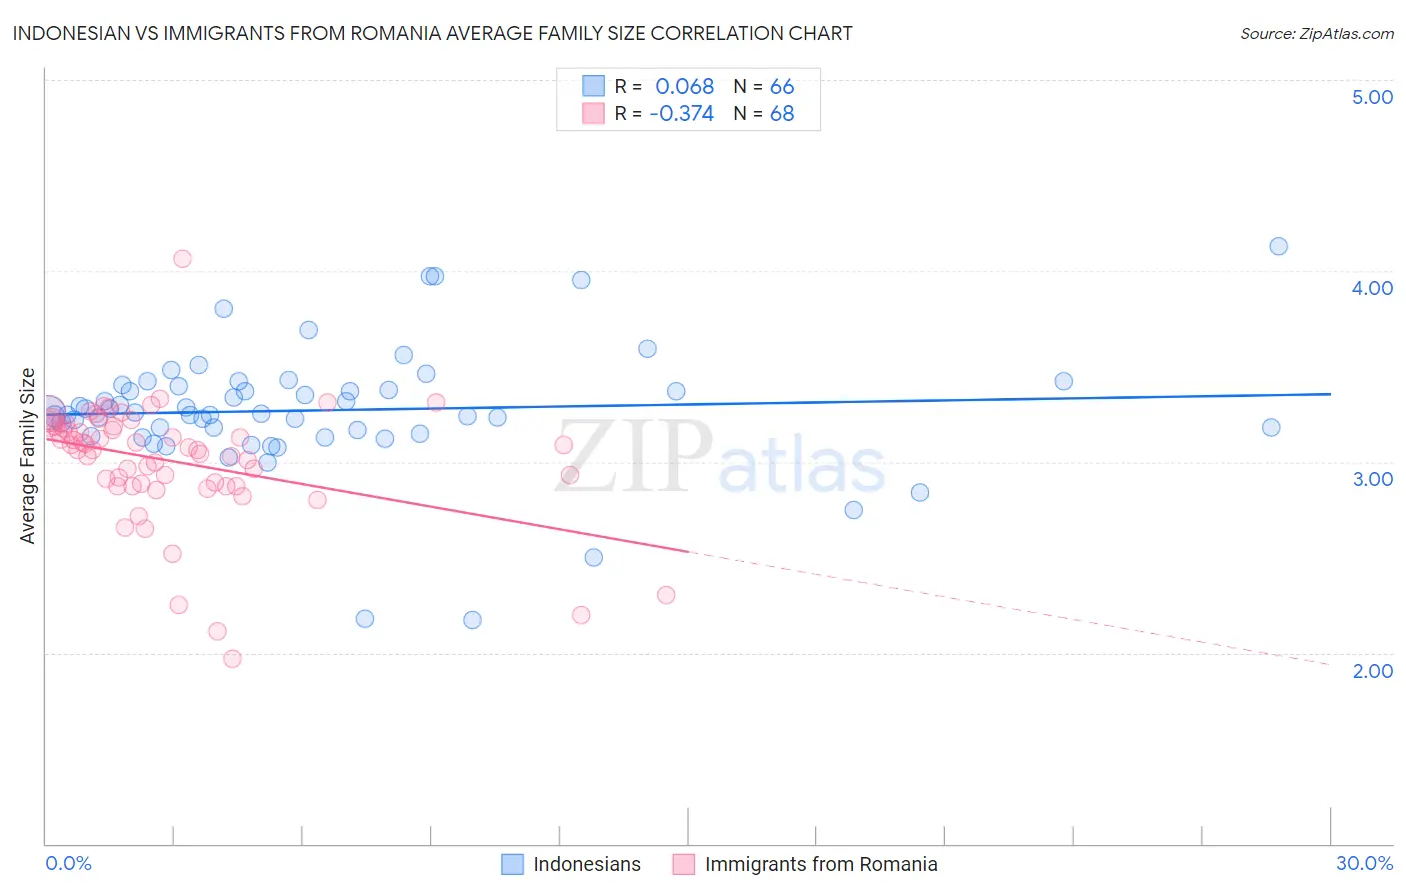
Indonesian vs Immigrants from Romania Average Family Size Correlation Chart
The statistical analysis conducted on geographies consisting of 162,608,656 people shows a slight positive correlation between the proportion of Indonesians and average family size in the United States with a correlation coefficient (R) of 0.068 and weighted average of 3.28. Similarly, the statistical analysis conducted on geographies consisting of 256,963,542 people shows a mild negative correlation between the proportion of Immigrants from Romania and average family size in the United States with a correlation coefficient (R) of -0.374 and weighted average of 3.18, a difference of 3.0%.
Average Family Size Correlation Summary
| Measurement | Indonesian | Immigrants from Romania |
| Minimum | 2.17 | 1.97 |
| Maximum | 4.13 | 4.06 |
| Range | 1.96 | 2.09 |
| Mean | 3.27 | 3.00 |
| Median | 3.25 | 3.07 |
| Interquartile 25% (IQ1) | 3.15 | 2.88 |
| Interquartile 75% (IQ3) | 3.40 | 3.19 |
| Interquartile Range (IQR) | 0.25 | 0.31 |
| Standard Deviation (Sample) | 0.33 | 0.32 |
| Standard Deviation (Population) | 0.33 | 0.32 |
Similar Demographics by Average Family Size
Demographics Similar to Indonesians by Average Family Size
In terms of average family size, the demographic groups most similar to Indonesians are Bahamian (3.28, a difference of 0.050%), Puerto Rican (3.28, a difference of 0.060%), Black/African American (3.27, a difference of 0.060%), Immigrants from Panama (3.27, a difference of 0.070%), and Asian (3.28, a difference of 0.11%).
| Demographics | Rating | Rank | Average Family Size |
| Bolivians | 98.3 /100 | #104 | Exceptional 3.29 |
| Immigrants | Ghana | 98.1 /100 | #105 | Exceptional 3.29 |
| Paiute | 98.0 /100 | #106 | Exceptional 3.29 |
| Ghanaians | 98.0 /100 | #107 | Exceptional 3.29 |
| Asians | 97.0 /100 | #108 | Exceptional 3.28 |
| Puerto Ricans | 96.7 /100 | #109 | Exceptional 3.28 |
| Bahamians | 96.6 /100 | #110 | Exceptional 3.28 |
| Indonesians | 96.2 /100 | #111 | Exceptional 3.28 |
| Blacks/African Americans | 95.7 /100 | #112 | Exceptional 3.27 |
| Immigrants | Panama | 95.6 /100 | #113 | Exceptional 3.27 |
| South Americans | 95.1 /100 | #114 | Exceptional 3.27 |
| Immigrants | Liberia | 95.0 /100 | #115 | Exceptional 3.27 |
| Immigrants | South America | 95.0 /100 | #116 | Exceptional 3.27 |
| Kiowa | 94.8 /100 | #117 | Exceptional 3.27 |
| Immigrants | Asia | 94.0 /100 | #118 | Exceptional 3.27 |
Demographics Similar to Immigrants from Romania by Average Family Size
In terms of average family size, the demographic groups most similar to Immigrants from Romania are Romanian (3.18, a difference of 0.0%), Immigrants from Portugal (3.18, a difference of 0.050%), Houma (3.18, a difference of 0.050%), Immigrants from Turkey (3.18, a difference of 0.060%), and Osage (3.18, a difference of 0.070%).
| Demographics | Rating | Rank | Average Family Size |
| Icelanders | 5.2 /100 | #230 | Tragic 3.19 |
| Basques | 5.2 /100 | #231 | Tragic 3.19 |
| Cherokee | 4.7 /100 | #232 | Tragic 3.18 |
| Brazilians | 4.5 /100 | #233 | Tragic 3.18 |
| Iranians | 4.5 /100 | #234 | Tragic 3.18 |
| Immigrants | Turkey | 4.2 /100 | #235 | Tragic 3.18 |
| Immigrants | Portugal | 4.2 /100 | #236 | Tragic 3.18 |
| Immigrants | Romania | 3.7 /100 | #237 | Tragic 3.18 |
| Romanians | 3.7 /100 | #238 | Tragic 3.18 |
| Houma | 3.4 /100 | #239 | Tragic 3.18 |
| Osage | 3.2 /100 | #240 | Tragic 3.18 |
| Immigrants | Japan | 3.0 /100 | #241 | Tragic 3.18 |
| Hungarians | 3.0 /100 | #242 | Tragic 3.18 |
| Immigrants | Moldova | 2.9 /100 | #243 | Tragic 3.18 |
| Immigrants | Southern Europe | 2.9 /100 | #244 | Tragic 3.18 |