Danish vs Immigrants from Egypt Average Family Size
COMPARE
Danish
Immigrants from Egypt
Average Family Size
Average Family Size Comparison
Danes
Immigrants from Egypt
3.17
AVERAGE FAMILY SIZE
2.5/ 100
METRIC RATING
246th/ 347
METRIC RANK
3.24
AVERAGE FAMILY SIZE
70.0/ 100
METRIC RATING
154th/ 347
METRIC RANK
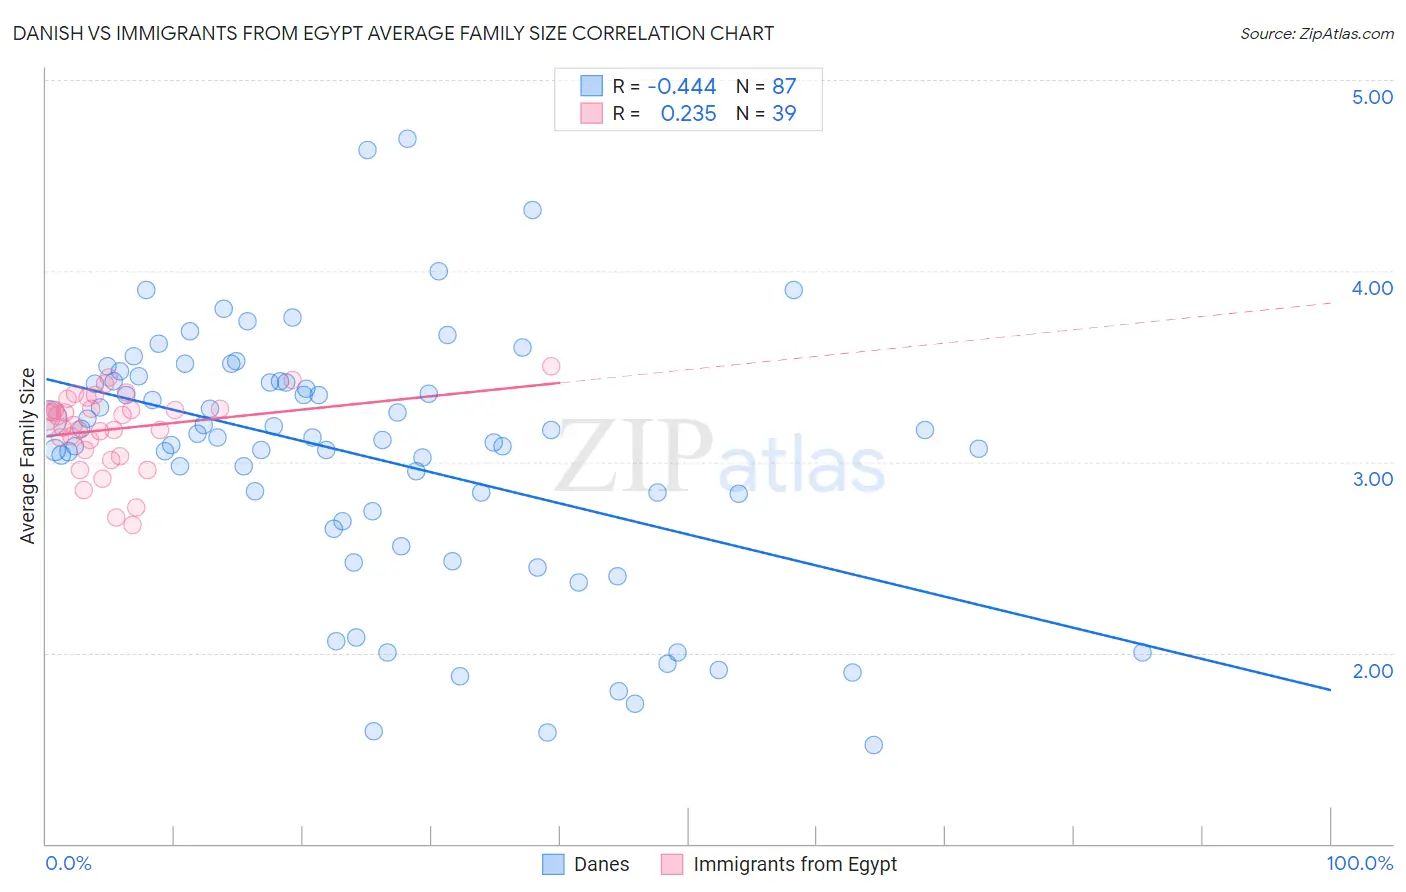
Danish vs Immigrants from Egypt Average Family Size Correlation Chart
The statistical analysis conducted on geographies consisting of 473,910,461 people shows a moderate negative correlation between the proportion of Danes and average family size in the United States with a correlation coefficient (R) of -0.444 and weighted average of 3.17. Similarly, the statistical analysis conducted on geographies consisting of 245,429,769 people shows a weak positive correlation between the proportion of Immigrants from Egypt and average family size in the United States with a correlation coefficient (R) of 0.235 and weighted average of 3.24, a difference of 2.1%.
Average Family Size Correlation Summary
| Measurement | Danish | Immigrants from Egypt |
| Minimum | 1.52 | 2.67 |
| Maximum | 4.69 | 3.50 |
| Range | 3.17 | 0.83 |
| Mean | 3.03 | 3.17 |
| Median | 3.12 | 3.24 |
| Interquartile 25% (IQ1) | 2.69 | 3.06 |
| Interquartile 75% (IQ3) | 3.42 | 3.28 |
| Interquartile Range (IQR) | 0.73 | 0.22 |
| Standard Deviation (Sample) | 0.67 | 0.20 |
| Standard Deviation (Population) | 0.66 | 0.20 |
Similar Demographics by Average Family Size
Demographics Similar to Danes by Average Family Size
In terms of average family size, the demographic groups most similar to Danes are Cajun (3.17, a difference of 0.010%), Immigrants from Brazil (3.18, a difference of 0.040%), Immigrants from Belarus (3.17, a difference of 0.040%), Immigrants from Southern Europe (3.18, a difference of 0.070%), and Hungarian (3.18, a difference of 0.080%).
| Demographics | Rating | Rank | Average Family Size |
| Houma | 3.4 /100 | #239 | Tragic 3.18 |
| Osage | 3.2 /100 | #240 | Tragic 3.18 |
| Immigrants | Japan | 3.0 /100 | #241 | Tragic 3.18 |
| Hungarians | 3.0 /100 | #242 | Tragic 3.18 |
| Immigrants | Moldova | 2.9 /100 | #243 | Tragic 3.18 |
| Immigrants | Southern Europe | 2.9 /100 | #244 | Tragic 3.18 |
| Immigrants | Brazil | 2.7 /100 | #245 | Tragic 3.18 |
| Danes | 2.5 /100 | #246 | Tragic 3.17 |
| Cajuns | 2.4 /100 | #247 | Tragic 3.17 |
| Immigrants | Belarus | 2.3 /100 | #248 | Tragic 3.17 |
| Immigrants | Eastern Europe | 2.1 /100 | #249 | Tragic 3.17 |
| Puget Sound Salish | 1.9 /100 | #250 | Tragic 3.17 |
| Immigrants | Spain | 1.8 /100 | #251 | Tragic 3.17 |
| Immigrants | Saudi Arabia | 1.7 /100 | #252 | Tragic 3.17 |
| South Africans | 1.7 /100 | #253 | Tragic 3.17 |
Demographics Similar to Immigrants from Egypt by Average Family Size
In terms of average family size, the demographic groups most similar to Immigrants from Egypt are Immigrants from Eritrea (3.24, a difference of 0.030%), Seminole (3.24, a difference of 0.040%), Immigrants from Taiwan (3.24, a difference of 0.040%), Spanish American (3.24, a difference of 0.060%), and Immigrants from Uzbekistan (3.24, a difference of 0.060%).
| Demographics | Rating | Rank | Average Family Size |
| Immigrants | Jordan | 75.7 /100 | #147 | Good 3.24 |
| Blackfeet | 75.0 /100 | #148 | Good 3.24 |
| Assyrians/Chaldeans/Syriacs | 73.8 /100 | #149 | Good 3.24 |
| Indians (Asian) | 73.6 /100 | #150 | Good 3.24 |
| Jordanians | 73.5 /100 | #151 | Good 3.24 |
| Spanish Americans | 72.5 /100 | #152 | Good 3.24 |
| Immigrants | Eritrea | 71.4 /100 | #153 | Good 3.24 |
| Immigrants | Egypt | 70.0 /100 | #154 | Good 3.24 |
| Seminole | 68.2 /100 | #155 | Good 3.24 |
| Immigrants | Taiwan | 68.1 /100 | #156 | Good 3.24 |
| Immigrants | Uzbekistan | 67.0 /100 | #157 | Good 3.24 |
| Iraqis | 64.3 /100 | #158 | Good 3.24 |
| Ethiopians | 63.9 /100 | #159 | Good 3.24 |
| Immigrants | Iraq | 63.7 /100 | #160 | Good 3.24 |
| Immigrants | Chile | 63.2 /100 | #161 | Good 3.24 |