Cuban vs Immigrants from Egypt Average Family Size
COMPARE
Cuban
Immigrants from Egypt
Average Family Size
Average Family Size Comparison
Cubans
Immigrants from Egypt
3.25
AVERAGE FAMILY SIZE
81.8/ 100
METRIC RATING
138th/ 347
METRIC RANK
3.24
AVERAGE FAMILY SIZE
70.0/ 100
METRIC RATING
154th/ 347
METRIC RANK
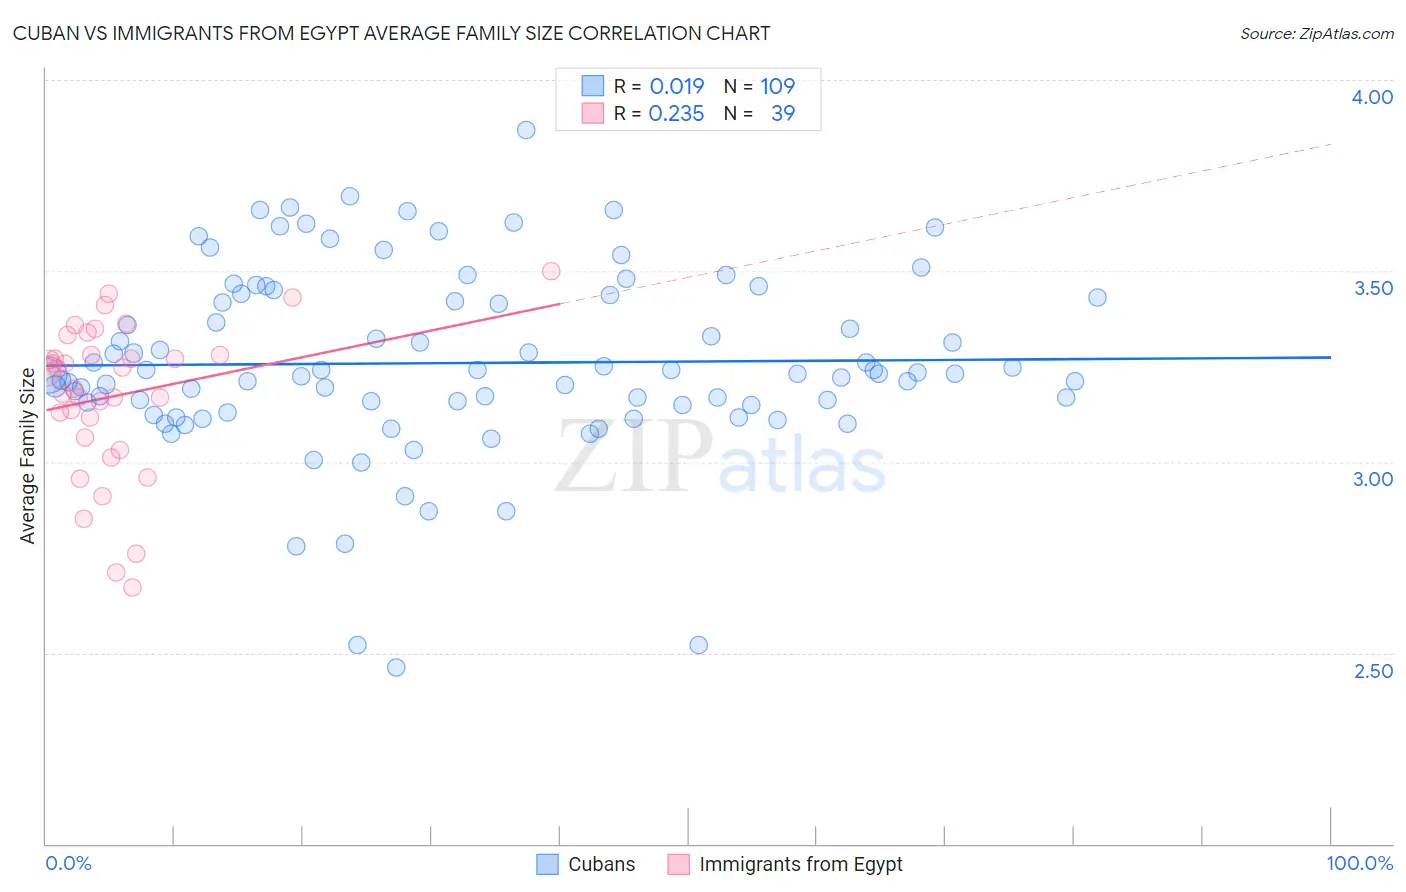
Cuban vs Immigrants from Egypt Average Family Size Correlation Chart
The statistical analysis conducted on geographies consisting of 448,974,535 people shows no correlation between the proportion of Cubans and average family size in the United States with a correlation coefficient (R) of 0.019 and weighted average of 3.25. Similarly, the statistical analysis conducted on geographies consisting of 245,429,769 people shows a weak positive correlation between the proportion of Immigrants from Egypt and average family size in the United States with a correlation coefficient (R) of 0.235 and weighted average of 3.24, a difference of 0.30%.
Average Family Size Correlation Summary
| Measurement | Cuban | Immigrants from Egypt |
| Minimum | 2.46 | 2.67 |
| Maximum | 3.87 | 3.50 |
| Range | 1.41 | 0.83 |
| Mean | 3.26 | 3.17 |
| Median | 3.23 | 3.24 |
| Interquartile 25% (IQ1) | 3.15 | 3.06 |
| Interquartile 75% (IQ3) | 3.43 | 3.28 |
| Interquartile Range (IQR) | 0.28 | 0.22 |
| Standard Deviation (Sample) | 0.24 | 0.20 |
| Standard Deviation (Population) | 0.24 | 0.20 |
Demographics Similar to Cubans and Immigrants from Egypt by Average Family Size
In terms of average family size, the demographic groups most similar to Cubans are Immigrants from Ethiopia (3.25, a difference of 0.010%), Subsaharan African (3.25, a difference of 0.010%), Venezuelan (3.25, a difference of 0.010%), Immigrants from Middle Africa (3.25, a difference of 0.020%), and Liberian (3.25, a difference of 0.020%). Similarly, the demographic groups most similar to Immigrants from Egypt are Immigrants from Eritrea (3.24, a difference of 0.030%), Seminole (3.24, a difference of 0.040%), Immigrants from Taiwan (3.24, a difference of 0.040%), Spanish American (3.24, a difference of 0.060%), and Assyrian/Chaldean/Syriac (3.24, a difference of 0.080%).
| Demographics | Rating | Rank | Average Family Size |
| Comanche | 82.8 /100 | #136 | Excellent 3.25 |
| Immigrants | Middle Africa | 82.4 /100 | #137 | Excellent 3.25 |
| Cubans | 81.8 /100 | #138 | Excellent 3.25 |
| Immigrants | Ethiopia | 81.6 /100 | #139 | Excellent 3.25 |
| Sub-Saharan Africans | 81.6 /100 | #140 | Excellent 3.25 |
| Venezuelans | 81.4 /100 | #141 | Excellent 3.25 |
| Liberians | 81.2 /100 | #142 | Excellent 3.25 |
| Bhutanese | 81.0 /100 | #143 | Excellent 3.25 |
| Tsimshian | 80.2 /100 | #144 | Excellent 3.25 |
| Armenians | 78.2 /100 | #145 | Good 3.25 |
| Immigrants | Africa | 77.9 /100 | #146 | Good 3.25 |
| Immigrants | Jordan | 75.7 /100 | #147 | Good 3.24 |
| Blackfeet | 75.0 /100 | #148 | Good 3.24 |
| Assyrians/Chaldeans/Syriacs | 73.8 /100 | #149 | Good 3.24 |
| Indians (Asian) | 73.6 /100 | #150 | Good 3.24 |
| Jordanians | 73.5 /100 | #151 | Good 3.24 |
| Spanish Americans | 72.5 /100 | #152 | Good 3.24 |
| Immigrants | Eritrea | 71.4 /100 | #153 | Good 3.24 |
| Immigrants | Egypt | 70.0 /100 | #154 | Good 3.24 |
| Seminole | 68.2 /100 | #155 | Good 3.24 |
| Immigrants | Taiwan | 68.1 /100 | #156 | Good 3.24 |