Immigrants from Germany vs Immigrants from Egypt Average Family Size
COMPARE
Immigrants from Germany
Immigrants from Egypt
Average Family Size
Average Family Size Comparison
Immigrants from Germany
Immigrants from Egypt
3.15
AVERAGE FAMILY SIZE
0.7/ 100
METRIC RATING
271st/ 347
METRIC RANK
3.24
AVERAGE FAMILY SIZE
70.0/ 100
METRIC RATING
154th/ 347
METRIC RANK
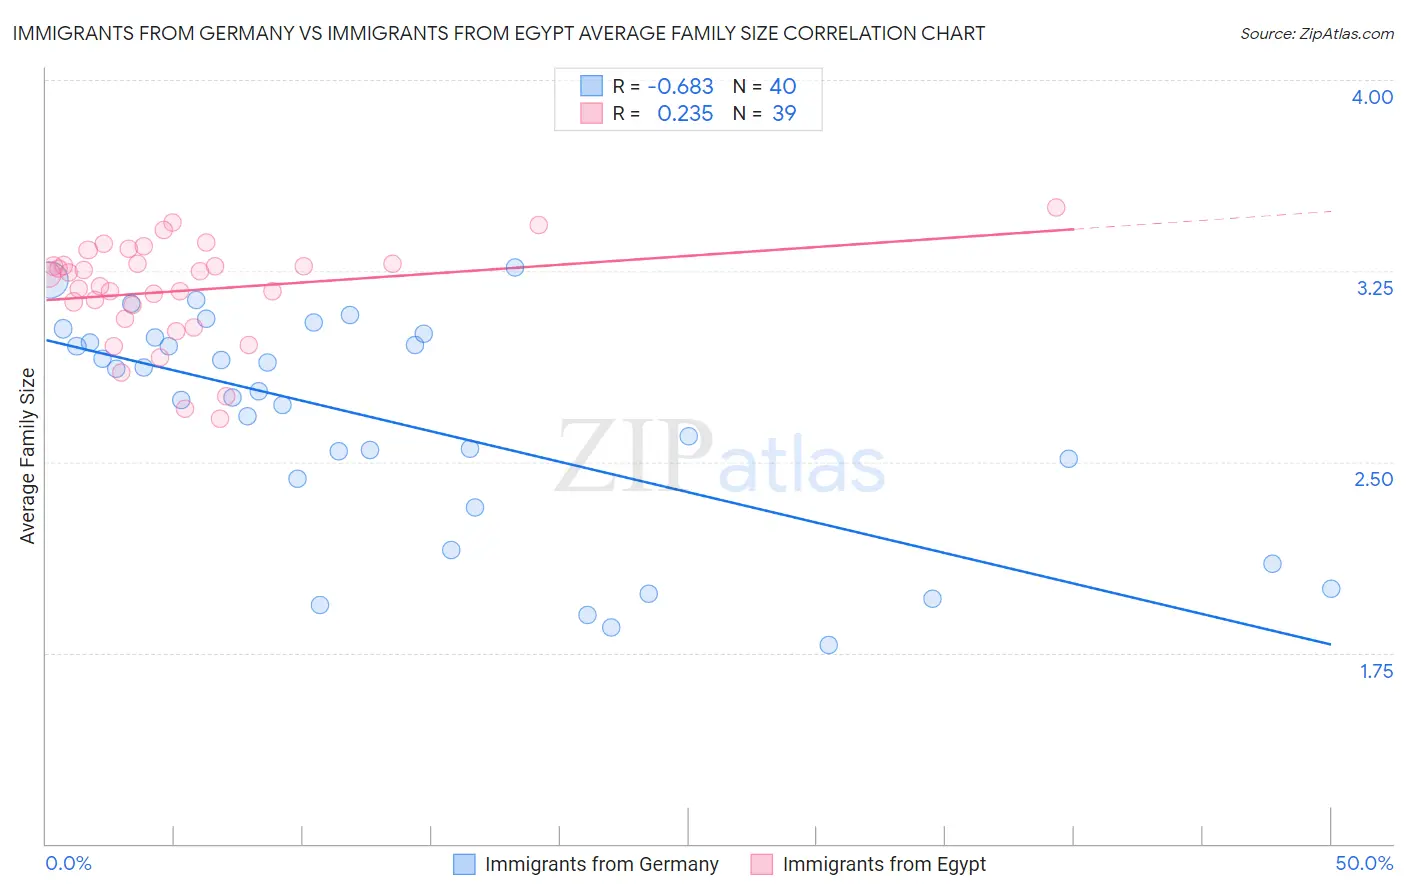
Immigrants from Germany vs Immigrants from Egypt Average Family Size Correlation Chart
The statistical analysis conducted on geographies consisting of 463,759,873 people shows a significant negative correlation between the proportion of Immigrants from Germany and average family size in the United States with a correlation coefficient (R) of -0.683 and weighted average of 3.15. Similarly, the statistical analysis conducted on geographies consisting of 245,429,769 people shows a weak positive correlation between the proportion of Immigrants from Egypt and average family size in the United States with a correlation coefficient (R) of 0.235 and weighted average of 3.24, a difference of 2.7%.
Average Family Size Correlation Summary
| Measurement | Immigrants from Germany | Immigrants from Egypt |
| Minimum | 1.78 | 2.67 |
| Maximum | 3.26 | 3.50 |
| Range | 1.48 | 0.83 |
| Mean | 2.65 | 3.17 |
| Median | 2.77 | 3.24 |
| Interquartile 25% (IQ1) | 2.38 | 3.06 |
| Interquartile 75% (IQ3) | 2.98 | 3.28 |
| Interquartile Range (IQR) | 0.60 | 0.22 |
| Standard Deviation (Sample) | 0.43 | 0.20 |
| Standard Deviation (Population) | 0.43 | 0.20 |
Similar Demographics by Average Family Size
Demographics Similar to Immigrants from Germany by Average Family Size
In terms of average family size, the demographic groups most similar to Immigrants from Germany are Tlingit-Haida (3.16, a difference of 0.020%), Immigrants from Lithuania (3.15, a difference of 0.020%), New Zealander (3.15, a difference of 0.030%), Immigrants from Belgium (3.15, a difference of 0.030%), and Cambodian (3.15, a difference of 0.040%).
| Demographics | Rating | Rank | Average Family Size |
| Americans | 1.0 /100 | #264 | Tragic 3.16 |
| Immigrants | South Africa | 0.9 /100 | #265 | Tragic 3.16 |
| Immigrants | Greece | 0.9 /100 | #266 | Tragic 3.16 |
| Iroquois | 0.8 /100 | #267 | Tragic 3.16 |
| Maltese | 0.8 /100 | #268 | Tragic 3.16 |
| Immigrants | Singapore | 0.7 /100 | #269 | Tragic 3.16 |
| Tlingit-Haida | 0.7 /100 | #270 | Tragic 3.16 |
| Immigrants | Germany | 0.7 /100 | #271 | Tragic 3.15 |
| Immigrants | Lithuania | 0.6 /100 | #272 | Tragic 3.15 |
| New Zealanders | 0.6 /100 | #273 | Tragic 3.15 |
| Immigrants | Belgium | 0.6 /100 | #274 | Tragic 3.15 |
| Cambodians | 0.6 /100 | #275 | Tragic 3.15 |
| Immigrants | Bosnia and Herzegovina | 0.5 /100 | #276 | Tragic 3.15 |
| Swiss | 0.5 /100 | #277 | Tragic 3.15 |
| Okinawans | 0.5 /100 | #278 | Tragic 3.15 |
Demographics Similar to Immigrants from Egypt by Average Family Size
In terms of average family size, the demographic groups most similar to Immigrants from Egypt are Immigrants from Eritrea (3.24, a difference of 0.030%), Seminole (3.24, a difference of 0.040%), Immigrants from Taiwan (3.24, a difference of 0.040%), Spanish American (3.24, a difference of 0.060%), and Immigrants from Uzbekistan (3.24, a difference of 0.060%).
| Demographics | Rating | Rank | Average Family Size |
| Immigrants | Jordan | 75.7 /100 | #147 | Good 3.24 |
| Blackfeet | 75.0 /100 | #148 | Good 3.24 |
| Assyrians/Chaldeans/Syriacs | 73.8 /100 | #149 | Good 3.24 |
| Indians (Asian) | 73.6 /100 | #150 | Good 3.24 |
| Jordanians | 73.5 /100 | #151 | Good 3.24 |
| Spanish Americans | 72.5 /100 | #152 | Good 3.24 |
| Immigrants | Eritrea | 71.4 /100 | #153 | Good 3.24 |
| Immigrants | Egypt | 70.0 /100 | #154 | Good 3.24 |
| Seminole | 68.2 /100 | #155 | Good 3.24 |
| Immigrants | Taiwan | 68.1 /100 | #156 | Good 3.24 |
| Immigrants | Uzbekistan | 67.0 /100 | #157 | Good 3.24 |
| Iraqis | 64.3 /100 | #158 | Good 3.24 |
| Ethiopians | 63.9 /100 | #159 | Good 3.24 |
| Immigrants | Iraq | 63.7 /100 | #160 | Good 3.24 |
| Immigrants | Chile | 63.2 /100 | #161 | Good 3.24 |