Guamanian/Chamorro vs Immigrants from Egypt Average Family Size
COMPARE
Guamanian/Chamorro
Immigrants from Egypt
Average Family Size
Average Family Size Comparison
Guamanians/Chamorros
Immigrants from Egypt
3.29
AVERAGE FAMILY SIZE
98.6/ 100
METRIC RATING
100th/ 347
METRIC RANK
3.24
AVERAGE FAMILY SIZE
70.0/ 100
METRIC RATING
154th/ 347
METRIC RANK
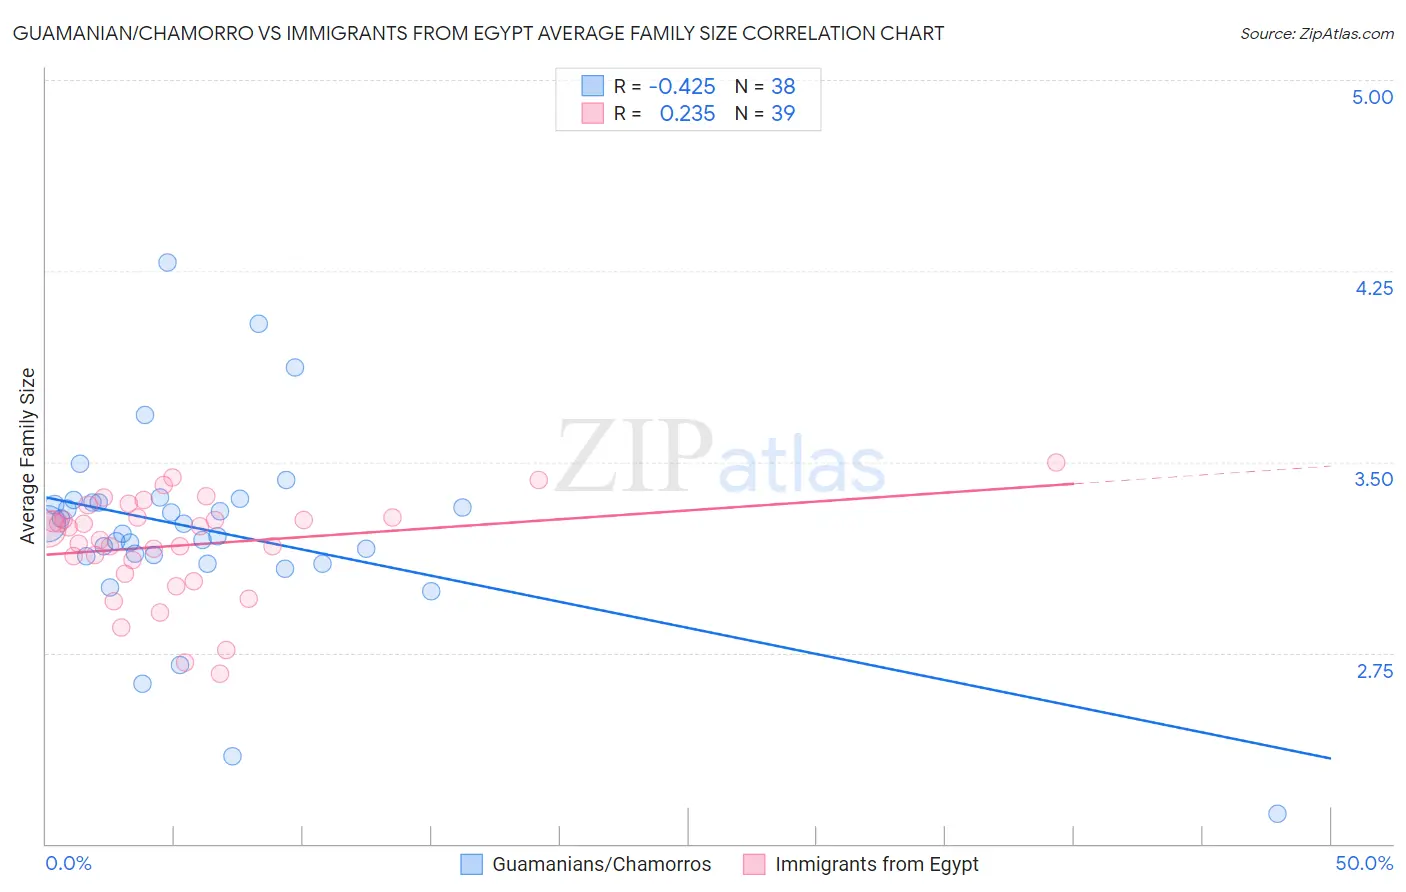
Guamanian/Chamorro vs Immigrants from Egypt Average Family Size Correlation Chart
The statistical analysis conducted on geographies consisting of 221,865,945 people shows a moderate negative correlation between the proportion of Guamanians/Chamorros and average family size in the United States with a correlation coefficient (R) of -0.425 and weighted average of 3.29. Similarly, the statistical analysis conducted on geographies consisting of 245,429,769 people shows a weak positive correlation between the proportion of Immigrants from Egypt and average family size in the United States with a correlation coefficient (R) of 0.235 and weighted average of 3.24, a difference of 1.5%.
Average Family Size Correlation Summary
| Measurement | Guamanian/Chamorro | Immigrants from Egypt |
| Minimum | 2.12 | 2.67 |
| Maximum | 4.28 | 3.50 |
| Range | 2.16 | 0.83 |
| Mean | 3.23 | 3.17 |
| Median | 3.24 | 3.24 |
| Interquartile 25% (IQ1) | 3.13 | 3.06 |
| Interquartile 75% (IQ3) | 3.34 | 3.28 |
| Interquartile Range (IQR) | 0.21 | 0.22 |
| Standard Deviation (Sample) | 0.38 | 0.20 |
| Standard Deviation (Population) | 0.38 | 0.20 |
Similar Demographics by Average Family Size
Demographics Similar to Guamanians/Chamorros by Average Family Size
In terms of average family size, the demographic groups most similar to Guamanians/Chamorros are Immigrants from Oceania (3.29, a difference of 0.010%), Barbadian (3.29, a difference of 0.010%), Nigerian (3.29, a difference of 0.010%), Immigrants from Burma/Myanmar (3.29, a difference of 0.020%), and West Indian (3.29, a difference of 0.020%).
| Demographics | Rating | Rank | Average Family Size |
| Peruvians | 99.2 /100 | #93 | Exceptional 3.30 |
| Sierra Leoneans | 99.0 /100 | #94 | Exceptional 3.30 |
| Immigrants | Lebanon | 99.0 /100 | #95 | Exceptional 3.30 |
| U.S. Virgin Islanders | 98.8 /100 | #96 | Exceptional 3.29 |
| Immigrants | Oceania | 98.7 /100 | #97 | Exceptional 3.29 |
| Barbadians | 98.6 /100 | #98 | Exceptional 3.29 |
| Nigerians | 98.6 /100 | #99 | Exceptional 3.29 |
| Guamanians/Chamorros | 98.6 /100 | #100 | Exceptional 3.29 |
| Immigrants | Burma/Myanmar | 98.6 /100 | #101 | Exceptional 3.29 |
| West Indians | 98.5 /100 | #102 | Exceptional 3.29 |
| Immigrants | Western Africa | 98.4 /100 | #103 | Exceptional 3.29 |
| Bolivians | 98.3 /100 | #104 | Exceptional 3.29 |
| Immigrants | Ghana | 98.1 /100 | #105 | Exceptional 3.29 |
| Paiute | 98.0 /100 | #106 | Exceptional 3.29 |
| Ghanaians | 98.0 /100 | #107 | Exceptional 3.29 |
Demographics Similar to Immigrants from Egypt by Average Family Size
In terms of average family size, the demographic groups most similar to Immigrants from Egypt are Immigrants from Eritrea (3.24, a difference of 0.030%), Seminole (3.24, a difference of 0.040%), Immigrants from Taiwan (3.24, a difference of 0.040%), Spanish American (3.24, a difference of 0.060%), and Immigrants from Uzbekistan (3.24, a difference of 0.060%).
| Demographics | Rating | Rank | Average Family Size |
| Immigrants | Jordan | 75.7 /100 | #147 | Good 3.24 |
| Blackfeet | 75.0 /100 | #148 | Good 3.24 |
| Assyrians/Chaldeans/Syriacs | 73.8 /100 | #149 | Good 3.24 |
| Indians (Asian) | 73.6 /100 | #150 | Good 3.24 |
| Jordanians | 73.5 /100 | #151 | Good 3.24 |
| Spanish Americans | 72.5 /100 | #152 | Good 3.24 |
| Immigrants | Eritrea | 71.4 /100 | #153 | Good 3.24 |
| Immigrants | Egypt | 70.0 /100 | #154 | Good 3.24 |
| Seminole | 68.2 /100 | #155 | Good 3.24 |
| Immigrants | Taiwan | 68.1 /100 | #156 | Good 3.24 |
| Immigrants | Uzbekistan | 67.0 /100 | #157 | Good 3.24 |
| Iraqis | 64.3 /100 | #158 | Good 3.24 |
| Ethiopians | 63.9 /100 | #159 | Good 3.24 |
| Immigrants | Iraq | 63.7 /100 | #160 | Good 3.24 |
| Immigrants | Chile | 63.2 /100 | #161 | Good 3.24 |