Indonesian vs Immigrants from Egypt Vision Disability
COMPARE
Indonesian
Immigrants from Egypt
Vision Disability
Vision Disability Comparison
Indonesians
Immigrants from Egypt
2.2%
VISION DISABILITY
9.5/ 100
METRIC RATING
211th/ 347
METRIC RANK
1.9%
VISION DISABILITY
99.9/ 100
METRIC RATING
33rd/ 347
METRIC RANK
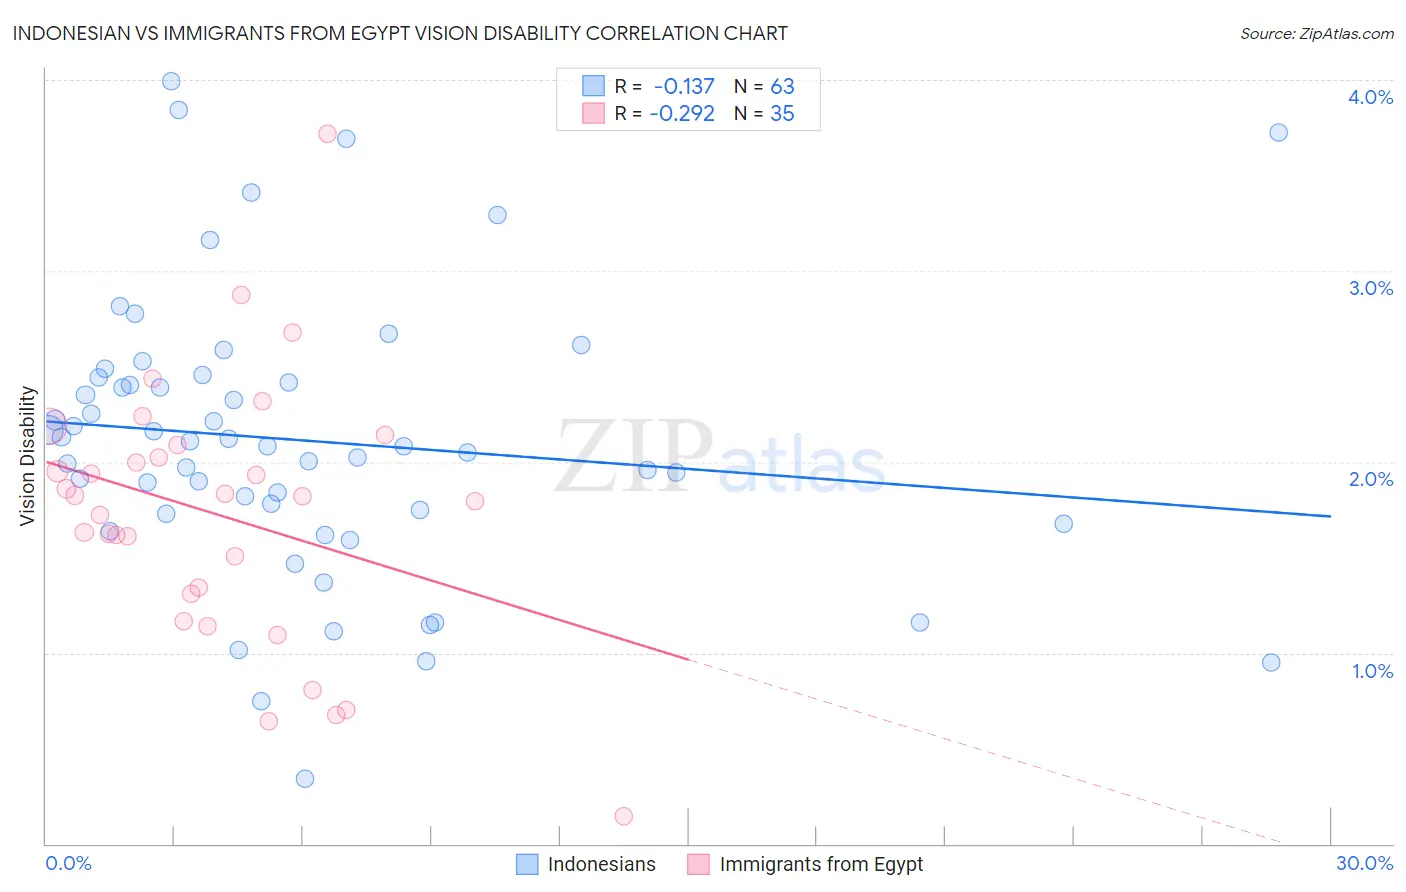
Indonesian vs Immigrants from Egypt Vision Disability Correlation Chart
The statistical analysis conducted on geographies consisting of 162,708,643 people shows a poor negative correlation between the proportion of Indonesians and percentage of population with vision disability in the United States with a correlation coefficient (R) of -0.137 and weighted average of 2.2%. Similarly, the statistical analysis conducted on geographies consisting of 245,409,407 people shows a weak negative correlation between the proportion of Immigrants from Egypt and percentage of population with vision disability in the United States with a correlation coefficient (R) of -0.292 and weighted average of 1.9%, a difference of 15.4%.
Vision Disability Correlation Summary
| Measurement | Indonesian | Immigrants from Egypt |
| Minimum | 0.34% | 0.14% |
| Maximum | 4.0% | 3.7% |
| Range | 3.7% | 3.6% |
| Mean | 2.1% | 1.7% |
| Median | 2.1% | 1.8% |
| Interquartile 25% (IQ1) | 1.7% | 1.3% |
| Interquartile 75% (IQ3) | 2.4% | 2.1% |
| Interquartile Range (IQR) | 0.71% | 0.78% |
| Standard Deviation (Sample) | 0.74% | 0.69% |
| Standard Deviation (Population) | 0.73% | 0.68% |
Similar Demographics by Vision Disability
Demographics Similar to Indonesians by Vision Disability
In terms of vision disability, the demographic groups most similar to Indonesians are Bermudan (2.2%, a difference of 0.090%), Immigrants from Ghana (2.2%, a difference of 0.10%), Trinidadian and Tobagonian (2.2%, a difference of 0.23%), Immigrants from Uruguay (2.2%, a difference of 0.34%), and Nigerian (2.3%, a difference of 0.44%).
| Demographics | Rating | Rank | Vision Disability |
| Immigrants | Guyana | 15.9 /100 | #204 | Poor 2.2% |
| Samoans | 15.7 /100 | #205 | Poor 2.2% |
| Pennsylvania Germans | 14.5 /100 | #206 | Poor 2.2% |
| Immigrants | Nigeria | 13.5 /100 | #207 | Poor 2.2% |
| Germans | 13.4 /100 | #208 | Poor 2.2% |
| Immigrants | Brazil | 13.1 /100 | #209 | Poor 2.2% |
| Immigrants | Uruguay | 11.5 /100 | #210 | Poor 2.2% |
| Indonesians | 9.5 /100 | #211 | Tragic 2.2% |
| Bermudans | 9.0 /100 | #212 | Tragic 2.2% |
| Immigrants | Ghana | 8.9 /100 | #213 | Tragic 2.2% |
| Trinidadians and Tobagonians | 8.2 /100 | #214 | Tragic 2.2% |
| Nigerians | 7.2 /100 | #215 | Tragic 2.3% |
| Immigrants | Trinidad and Tobago | 6.1 /100 | #216 | Tragic 2.3% |
| Barbadians | 5.1 /100 | #217 | Tragic 2.3% |
| Portuguese | 4.9 /100 | #218 | Tragic 2.3% |
Demographics Similar to Immigrants from Egypt by Vision Disability
In terms of vision disability, the demographic groups most similar to Immigrants from Egypt are Immigrants from Turkey (1.9%, a difference of 0.13%), Immigrants from Australia (1.9%, a difference of 0.22%), Luxembourger (1.9%, a difference of 0.31%), Cambodian (2.0%, a difference of 0.57%), and Mongolian (1.9%, a difference of 0.58%).
| Demographics | Rating | Rank | Vision Disability |
| Immigrants | Japan | 99.9 /100 | #26 | Exceptional 1.9% |
| Taiwanese | 99.9 /100 | #27 | Exceptional 1.9% |
| Immigrants | Malaysia | 99.9 /100 | #28 | Exceptional 1.9% |
| Egyptians | 99.9 /100 | #29 | Exceptional 1.9% |
| Immigrants | Nepal | 99.9 /100 | #30 | Exceptional 1.9% |
| Mongolians | 99.9 /100 | #31 | Exceptional 1.9% |
| Luxembourgers | 99.9 /100 | #32 | Exceptional 1.9% |
| Immigrants | Egypt | 99.9 /100 | #33 | Exceptional 1.9% |
| Immigrants | Turkey | 99.8 /100 | #34 | Exceptional 1.9% |
| Immigrants | Australia | 99.8 /100 | #35 | Exceptional 1.9% |
| Cambodians | 99.8 /100 | #36 | Exceptional 2.0% |
| Bhutanese | 99.8 /100 | #37 | Exceptional 2.0% |
| Immigrants | Kuwait | 99.8 /100 | #38 | Exceptional 2.0% |
| Zimbabweans | 99.7 /100 | #39 | Exceptional 2.0% |
| Immigrants | Ireland | 99.7 /100 | #40 | Exceptional 2.0% |