Indonesian vs Albanian Unemployment Among Ages 65 to 74 years
COMPARE
Indonesian
Albanian
Unemployment Among Ages 65 to 74 years
Unemployment Among Ages 65 to 74 years Comparison
Indonesians
Albanians
4.7%
UNEMPLOYMENT AMONG AGES 65 TO 74 YEARS
100.0/ 100
METRIC RATING
7th/ 347
METRIC RANK
5.4%
UNEMPLOYMENT AMONG AGES 65 TO 74 YEARS
17.8/ 100
METRIC RATING
198th/ 347
METRIC RANK
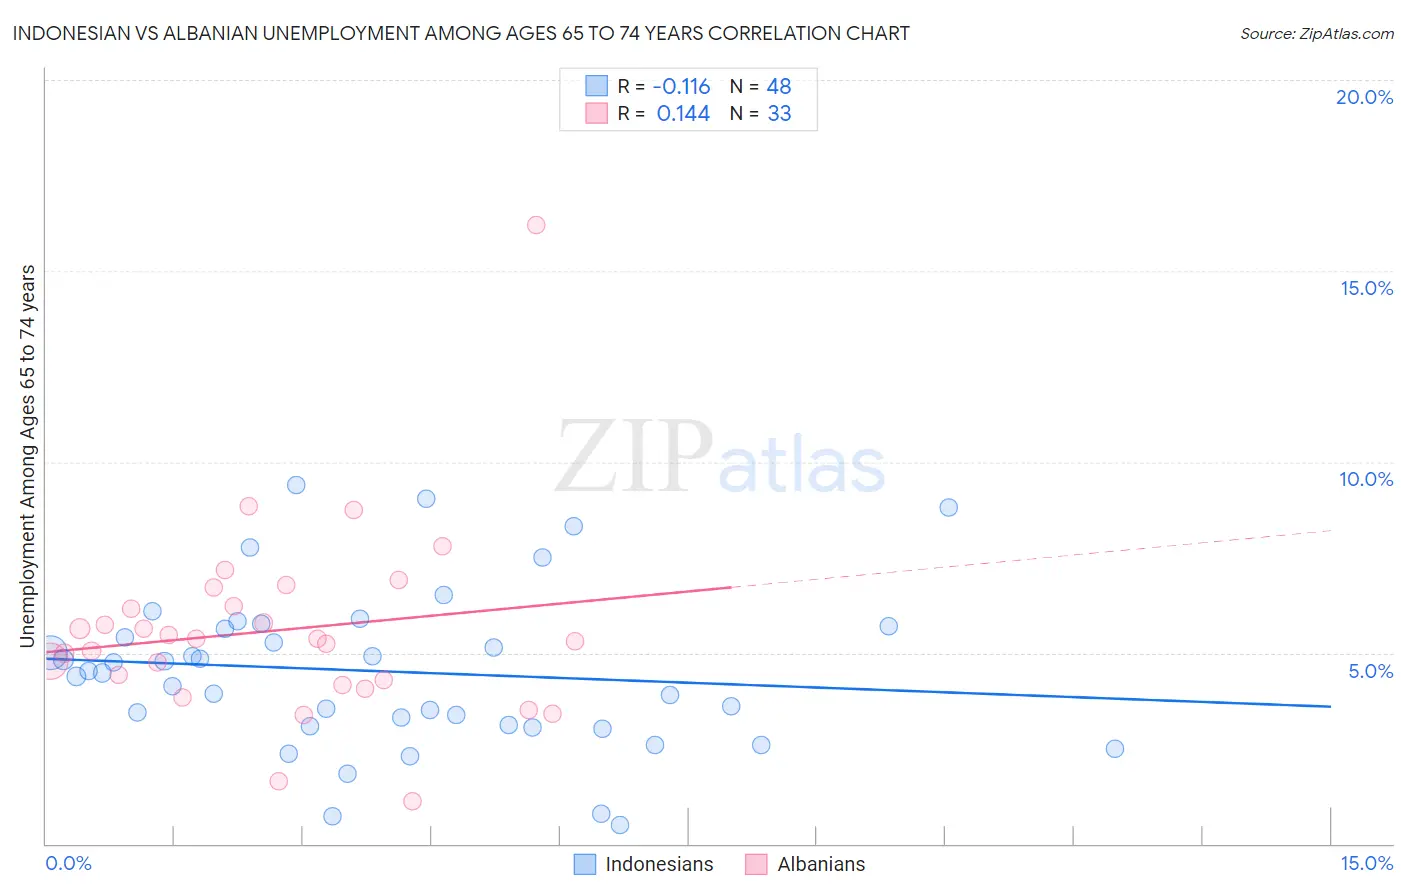
Indonesian vs Albanian Unemployment Among Ages 65 to 74 years Correlation Chart
The statistical analysis conducted on geographies consisting of 153,340,120 people shows a poor negative correlation between the proportion of Indonesians and unemployment rate among population between the ages 65 and 74 in the United States with a correlation coefficient (R) of -0.116 and weighted average of 4.7%. Similarly, the statistical analysis conducted on geographies consisting of 179,712,843 people shows a poor positive correlation between the proportion of Albanians and unemployment rate among population between the ages 65 and 74 in the United States with a correlation coefficient (R) of 0.144 and weighted average of 5.4%, a difference of 15.8%.
Unemployment Among Ages 65 to 74 years Correlation Summary
| Measurement | Indonesian | Albanian |
| Minimum | 0.50% | 1.1% |
| Maximum | 9.4% | 16.2% |
| Range | 8.9% | 15.1% |
| Mean | 4.5% | 5.6% |
| Median | 4.5% | 5.4% |
| Interquartile 25% (IQ1) | 3.1% | 4.2% |
| Interquartile 75% (IQ3) | 5.7% | 6.5% |
| Interquartile Range (IQR) | 2.6% | 2.2% |
| Standard Deviation (Sample) | 2.1% | 2.6% |
| Standard Deviation (Population) | 2.1% | 2.5% |
Similar Demographics by Unemployment Among Ages 65 to 74 years
Demographics Similar to Indonesians by Unemployment Among Ages 65 to 74 years
In terms of unemployment among ages 65 to 74 years, the demographic groups most similar to Indonesians are Comanche (4.7%, a difference of 0.17%), Chickasaw (4.7%, a difference of 0.43%), Osage (4.7%, a difference of 0.55%), Immigrants from Congo (4.7%, a difference of 0.96%), and Tongan (4.7%, a difference of 1.1%).
| Demographics | Rating | Rank | Unemployment Among Ages 65 to 74 years |
| Hmong | 100.0 /100 | #1 | Exceptional 4.2% |
| Chinese | 100.0 /100 | #2 | Exceptional 4.4% |
| Fijians | 100.0 /100 | #3 | Exceptional 4.5% |
| Tsimshian | 100.0 /100 | #4 | Exceptional 4.6% |
| Sudanese | 100.0 /100 | #5 | Exceptional 4.6% |
| Immigrants | Cuba | 100.0 /100 | #6 | Exceptional 4.6% |
| Indonesians | 100.0 /100 | #7 | Exceptional 4.7% |
| Comanche | 100.0 /100 | #8 | Exceptional 4.7% |
| Chickasaw | 100.0 /100 | #9 | Exceptional 4.7% |
| Osage | 100.0 /100 | #10 | Exceptional 4.7% |
| Immigrants | Congo | 100.0 /100 | #11 | Exceptional 4.7% |
| Tongans | 100.0 /100 | #12 | Exceptional 4.7% |
| Lumbee | 100.0 /100 | #13 | Exceptional 4.8% |
| Cubans | 100.0 /100 | #14 | Exceptional 4.8% |
| Immigrants | North Macedonia | 100.0 /100 | #15 | Exceptional 4.8% |
Demographics Similar to Albanians by Unemployment Among Ages 65 to 74 years
In terms of unemployment among ages 65 to 74 years, the demographic groups most similar to Albanians are Immigrants from Belgium (5.4%, a difference of 0.10%), Colville (5.4%, a difference of 0.14%), Immigrants from Pakistan (5.4%, a difference of 0.16%), Costa Rican (5.4%, a difference of 0.17%), and Immigrants from Western Asia (5.4%, a difference of 0.18%).
| Demographics | Rating | Rank | Unemployment Among Ages 65 to 74 years |
| Immigrants | Egypt | 26.5 /100 | #191 | Fair 5.4% |
| Maltese | 26.4 /100 | #192 | Fair 5.4% |
| Cherokee | 25.8 /100 | #193 | Fair 5.4% |
| Immigrants | Denmark | 24.7 /100 | #194 | Fair 5.4% |
| Immigrants | China | 24.2 /100 | #195 | Fair 5.4% |
| Costa Ricans | 21.1 /100 | #196 | Fair 5.4% |
| Colville | 20.4 /100 | #197 | Fair 5.4% |
| Albanians | 17.8 /100 | #198 | Poor 5.4% |
| Immigrants | Belgium | 16.2 /100 | #199 | Poor 5.4% |
| Immigrants | Pakistan | 15.2 /100 | #200 | Poor 5.4% |
| Immigrants | Western Asia | 14.9 /100 | #201 | Poor 5.4% |
| Sub-Saharan Africans | 14.4 /100 | #202 | Poor 5.4% |
| Argentineans | 14.3 /100 | #203 | Poor 5.4% |
| Seminole | 14.3 /100 | #204 | Poor 5.4% |
| Icelanders | 14.2 /100 | #205 | Poor 5.4% |