Indian (Asian) vs Japanese Married-couple Households
COMPARE
Indian (Asian)
Japanese
Married-couple Households
Married-couple Households Comparison
Indians (Asian)
Japanese
48.7%
MARRIED-COUPLE HOUSEHOLDS
99.4/ 100
METRIC RATING
48th/ 347
METRIC RANK
45.2%
MARRIED-COUPLE HOUSEHOLDS
5.7/ 100
METRIC RATING
214th/ 347
METRIC RANK
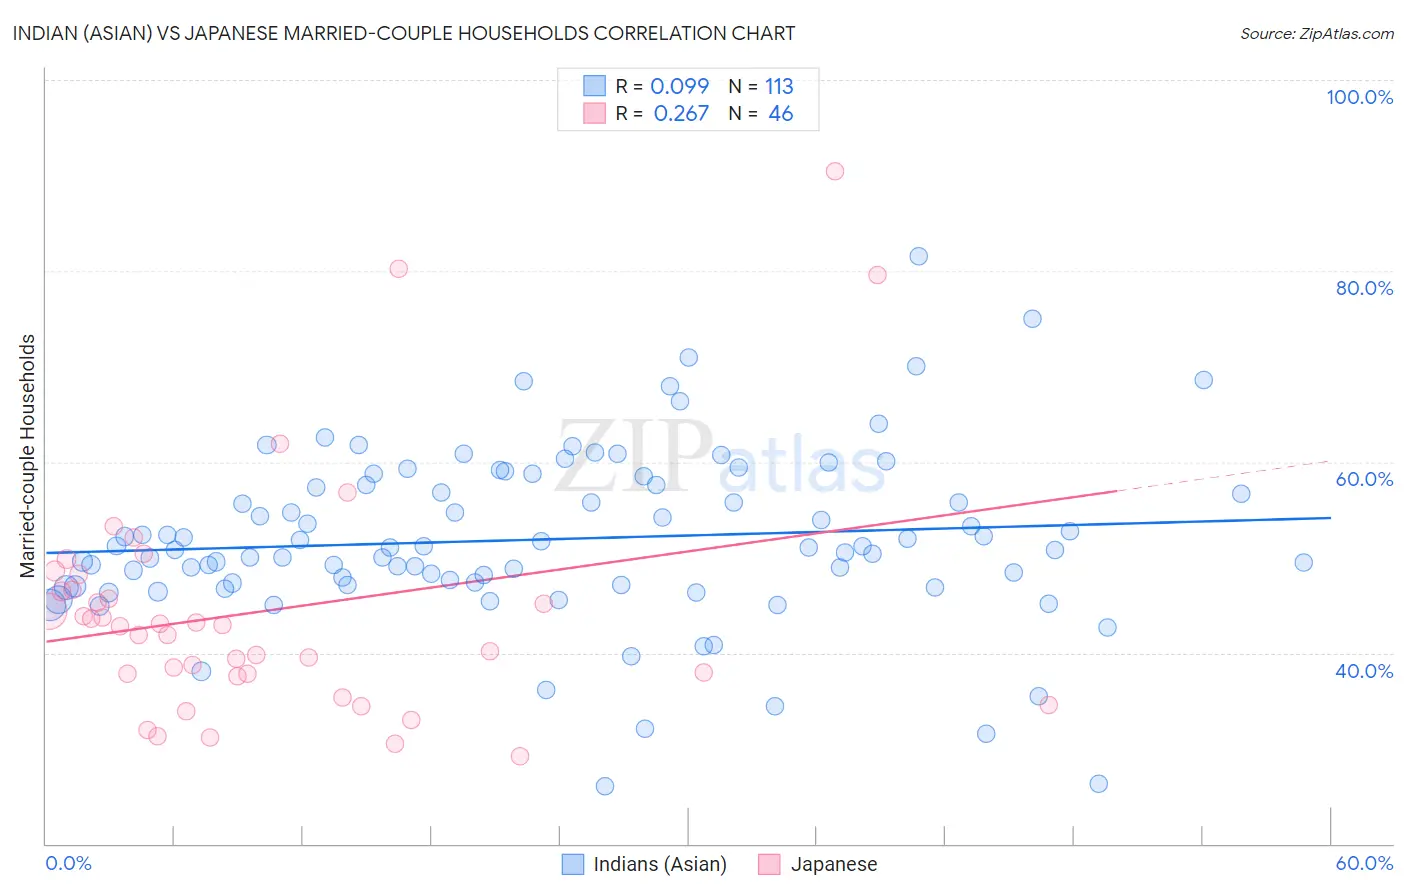
Indian (Asian) vs Japanese Married-couple Households Correlation Chart
The statistical analysis conducted on geographies consisting of 494,754,357 people shows a slight positive correlation between the proportion of Indians (Asian) and percentage of married-couple family households in the United States with a correlation coefficient (R) of 0.099 and weighted average of 48.7%. Similarly, the statistical analysis conducted on geographies consisting of 249,071,577 people shows a weak positive correlation between the proportion of Japanese and percentage of married-couple family households in the United States with a correlation coefficient (R) of 0.267 and weighted average of 45.2%, a difference of 7.7%.
Married-couple Households Correlation Summary
| Measurement | Indian (Asian) | Japanese |
| Minimum | 26.0% | 29.2% |
| Maximum | 81.5% | 90.5% |
| Range | 55.5% | 61.3% |
| Mean | 51.9% | 44.4% |
| Median | 51.0% | 42.9% |
| Interquartile 25% (IQ1) | 47.1% | 37.8% |
| Interquartile 75% (IQ3) | 57.6% | 46.6% |
| Interquartile Range (IQR) | 10.5% | 8.8% |
| Standard Deviation (Sample) | 9.1% | 12.6% |
| Standard Deviation (Population) | 9.0% | 12.5% |
Similar Demographics by Married-couple Households
Demographics Similar to Indians (Asian) by Married-couple Households
In terms of married-couple households, the demographic groups most similar to Indians (Asian) are British (48.7%, a difference of 0.050%), Immigrants from Sri Lanka (48.7%, a difference of 0.060%), Tsimshian (48.7%, a difference of 0.070%), Samoan (48.7%, a difference of 0.10%), and Immigrants from Eastern Asia (48.8%, a difference of 0.12%).
| Demographics | Rating | Rank | Married-couple Households |
| Immigrants | Lebanon | 99.6 /100 | #41 | Exceptional 48.9% |
| Immigrants | Vietnam | 99.6 /100 | #42 | Exceptional 48.8% |
| Immigrants | Iran | 99.6 /100 | #43 | Exceptional 48.8% |
| Welsh | 99.5 /100 | #44 | Exceptional 48.8% |
| Immigrants | Eastern Asia | 99.5 /100 | #45 | Exceptional 48.8% |
| Tsimshian | 99.5 /100 | #46 | Exceptional 48.7% |
| British | 99.5 /100 | #47 | Exceptional 48.7% |
| Indians (Asian) | 99.4 /100 | #48 | Exceptional 48.7% |
| Immigrants | Sri Lanka | 99.4 /100 | #49 | Exceptional 48.7% |
| Samoans | 99.4 /100 | #50 | Exceptional 48.7% |
| Eastern Europeans | 99.3 /100 | #51 | Exceptional 48.6% |
| Irish | 99.3 /100 | #52 | Exceptional 48.6% |
| Whites/Caucasians | 99.3 /100 | #53 | Exceptional 48.6% |
| Immigrants | Lithuania | 99.3 /100 | #54 | Exceptional 48.6% |
| Austrians | 99.3 /100 | #55 | Exceptional 48.6% |
Demographics Similar to Japanese by Married-couple Households
In terms of married-couple households, the demographic groups most similar to Japanese are Yakama (45.2%, a difference of 0.020%), Immigrants from Nepal (45.2%, a difference of 0.020%), Immigrants from Portugal (45.2%, a difference of 0.020%), Panamanian (45.2%, a difference of 0.040%), and Immigrants from the Azores (45.2%, a difference of 0.070%).
| Demographics | Rating | Rank | Married-couple Households |
| Immigrants | France | 8.8 /100 | #207 | Tragic 45.4% |
| Hispanics or Latinos | 8.7 /100 | #208 | Tragic 45.4% |
| Immigrants | Uzbekistan | 8.4 /100 | #209 | Tragic 45.4% |
| Cubans | 7.7 /100 | #210 | Tragic 45.4% |
| Immigrants | Spain | 7.3 /100 | #211 | Tragic 45.3% |
| Creek | 6.4 /100 | #212 | Tragic 45.3% |
| Yakama | 5.8 /100 | #213 | Tragic 45.2% |
| Japanese | 5.7 /100 | #214 | Tragic 45.2% |
| Immigrants | Nepal | 5.6 /100 | #215 | Tragic 45.2% |
| Immigrants | Portugal | 5.6 /100 | #216 | Tragic 45.2% |
| Panamanians | 5.5 /100 | #217 | Tragic 45.2% |
| Immigrants | Azores | 5.3 /100 | #218 | Tragic 45.2% |
| Nicaraguans | 5.3 /100 | #219 | Tragic 45.2% |
| Immigrants | Thailand | 5.1 /100 | #220 | Tragic 45.2% |
| Tlingit-Haida | 4.9 /100 | #221 | Tragic 45.1% |