Hawaiian vs Native/Alaskan Currently Married
COMPARE
Hawaiian
Native/Alaskan
Currently Married
Currently Married Comparison
Hawaiians
Natives/Alaskans
46.6%
CURRENTLY MARRIED
48.6/ 100
METRIC RATING
176th/ 347
METRIC RANK
42.8%
CURRENTLY MARRIED
0.0/ 100
METRIC RATING
288th/ 347
METRIC RANK
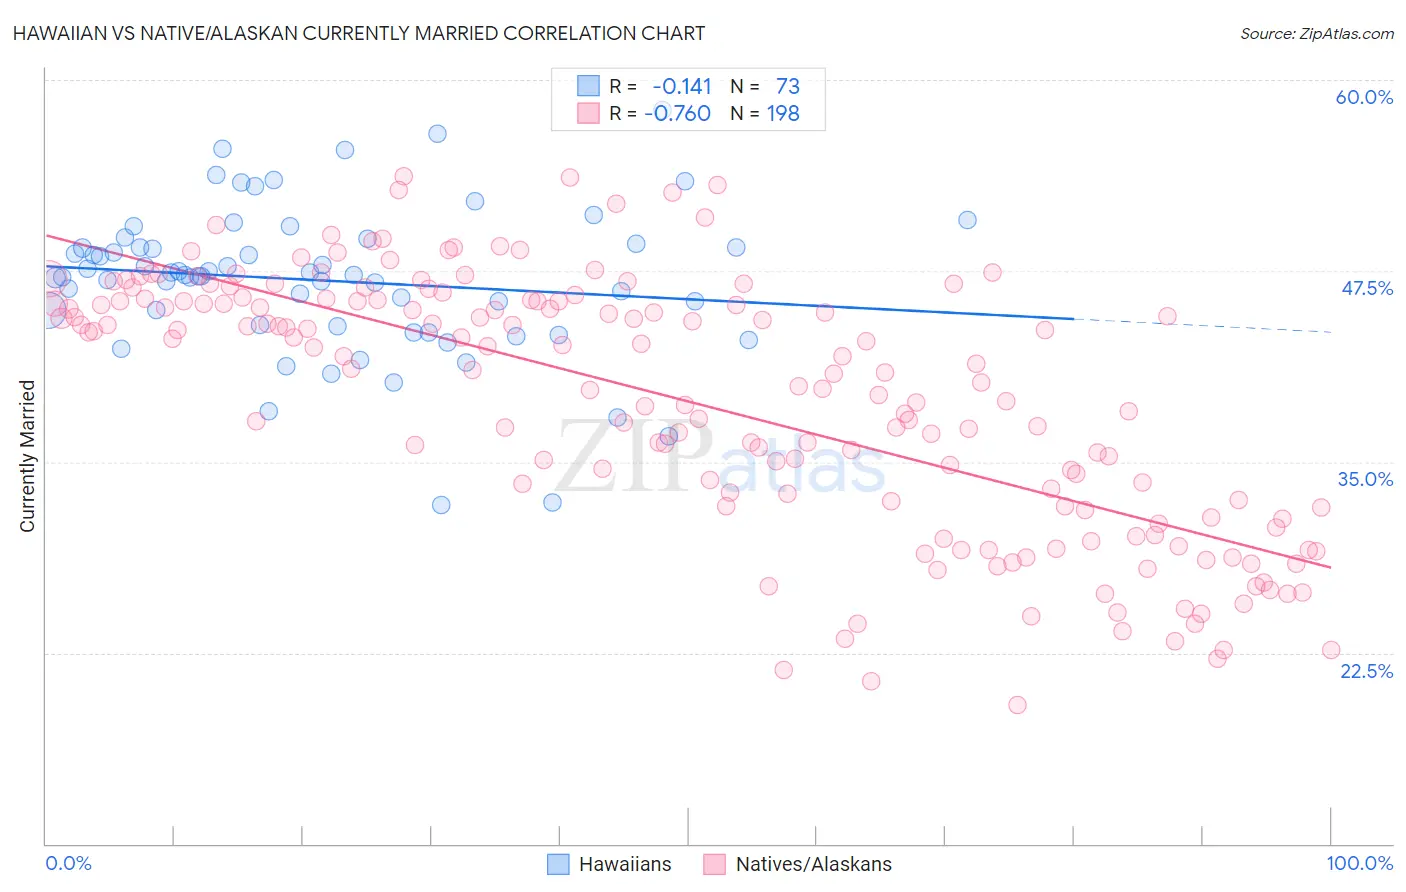
Hawaiian vs Native/Alaskan Currently Married Correlation Chart
The statistical analysis conducted on geographies consisting of 327,570,403 people shows a poor negative correlation between the proportion of Hawaiians and percentage of population currently married in the United States with a correlation coefficient (R) of -0.141 and weighted average of 46.6%. Similarly, the statistical analysis conducted on geographies consisting of 512,977,387 people shows a strong negative correlation between the proportion of Natives/Alaskans and percentage of population currently married in the United States with a correlation coefficient (R) of -0.760 and weighted average of 42.8%, a difference of 8.9%.
Currently Married Correlation Summary
| Measurement | Hawaiian | Native/Alaskan |
| Minimum | 32.2% | 19.1% |
| Maximum | 58.0% | 53.7% |
| Range | 25.8% | 34.6% |
| Mean | 46.9% | 38.9% |
| Median | 47.2% | 41.0% |
| Interquartile 25% (IQ1) | 43.9% | 32.1% |
| Interquartile 75% (IQ3) | 49.2% | 45.5% |
| Interquartile Range (IQR) | 5.2% | 13.5% |
| Standard Deviation (Sample) | 4.9% | 8.3% |
| Standard Deviation (Population) | 4.9% | 8.3% |
Similar Demographics by Currently Married
Demographics Similar to Hawaiians by Currently Married
In terms of currently married, the demographic groups most similar to Hawaiians are Israeli (46.6%, a difference of 0.0%), Chickasaw (46.6%, a difference of 0.030%), Peruvian (46.6%, a difference of 0.050%), Immigrants from Brazil (46.6%, a difference of 0.050%), and Tlingit-Haida (46.7%, a difference of 0.090%).
| Demographics | Rating | Rank | Currently Married |
| Armenians | 58.2 /100 | #169 | Average 46.8% |
| Immigrants | Latvia | 56.7 /100 | #170 | Average 46.7% |
| Immigrants | Zimbabwe | 52.4 /100 | #171 | Average 46.7% |
| Aleuts | 52.0 /100 | #172 | Average 46.7% |
| Tlingit-Haida | 51.2 /100 | #173 | Average 46.7% |
| Peruvians | 50.0 /100 | #174 | Average 46.6% |
| Immigrants | Brazil | 49.9 /100 | #175 | Average 46.6% |
| Hawaiians | 48.6 /100 | #176 | Average 46.6% |
| Israelis | 48.6 /100 | #177 | Average 46.6% |
| Chickasaw | 47.8 /100 | #178 | Average 46.6% |
| Immigrants | Oceania | 44.6 /100 | #179 | Average 46.5% |
| Costa Ricans | 43.7 /100 | #180 | Average 46.5% |
| Ottawa | 43.0 /100 | #181 | Average 46.5% |
| Potawatomi | 41.9 /100 | #182 | Average 46.5% |
| Immigrants | Northern Africa | 39.7 /100 | #183 | Fair 46.5% |
Demographics Similar to Natives/Alaskans by Currently Married
In terms of currently married, the demographic groups most similar to Natives/Alaskans are Paiute (42.7%, a difference of 0.23%), Immigrants from Ghana (42.7%, a difference of 0.24%), Guatemalan (42.9%, a difference of 0.27%), Ghanaian (42.9%, a difference of 0.29%), and Immigrants from Guatemala (42.6%, a difference of 0.36%).
| Demographics | Rating | Rank | Currently Married |
| Chippewa | 0.0 /100 | #281 | Tragic 43.2% |
| Immigrants | Ecuador | 0.0 /100 | #282 | Tragic 43.2% |
| Kiowa | 0.0 /100 | #283 | Tragic 43.2% |
| Immigrants | El Salvador | 0.0 /100 | #284 | Tragic 43.1% |
| Immigrants | Middle Africa | 0.0 /100 | #285 | Tragic 43.0% |
| Ghanaians | 0.0 /100 | #286 | Tragic 42.9% |
| Guatemalans | 0.0 /100 | #287 | Tragic 42.9% |
| Natives/Alaskans | 0.0 /100 | #288 | Tragic 42.8% |
| Paiute | 0.0 /100 | #289 | Tragic 42.7% |
| Immigrants | Ghana | 0.0 /100 | #290 | Tragic 42.7% |
| Immigrants | Guatemala | 0.0 /100 | #291 | Tragic 42.6% |
| Sub-Saharan Africans | 0.0 /100 | #292 | Tragic 42.6% |
| Yuman | 0.0 /100 | #293 | Tragic 42.6% |
| Hondurans | 0.0 /100 | #294 | Tragic 42.5% |
| Immigrants | Western Africa | 0.0 /100 | #295 | Tragic 42.4% |