African vs Native/Alaskan Currently Married
COMPARE
African
Native/Alaskan
Currently Married
Currently Married Comparison
Africans
Natives/Alaskans
41.8%
CURRENTLY MARRIED
0.0/ 100
METRIC RATING
307th/ 347
METRIC RANK
42.8%
CURRENTLY MARRIED
0.0/ 100
METRIC RATING
288th/ 347
METRIC RANK
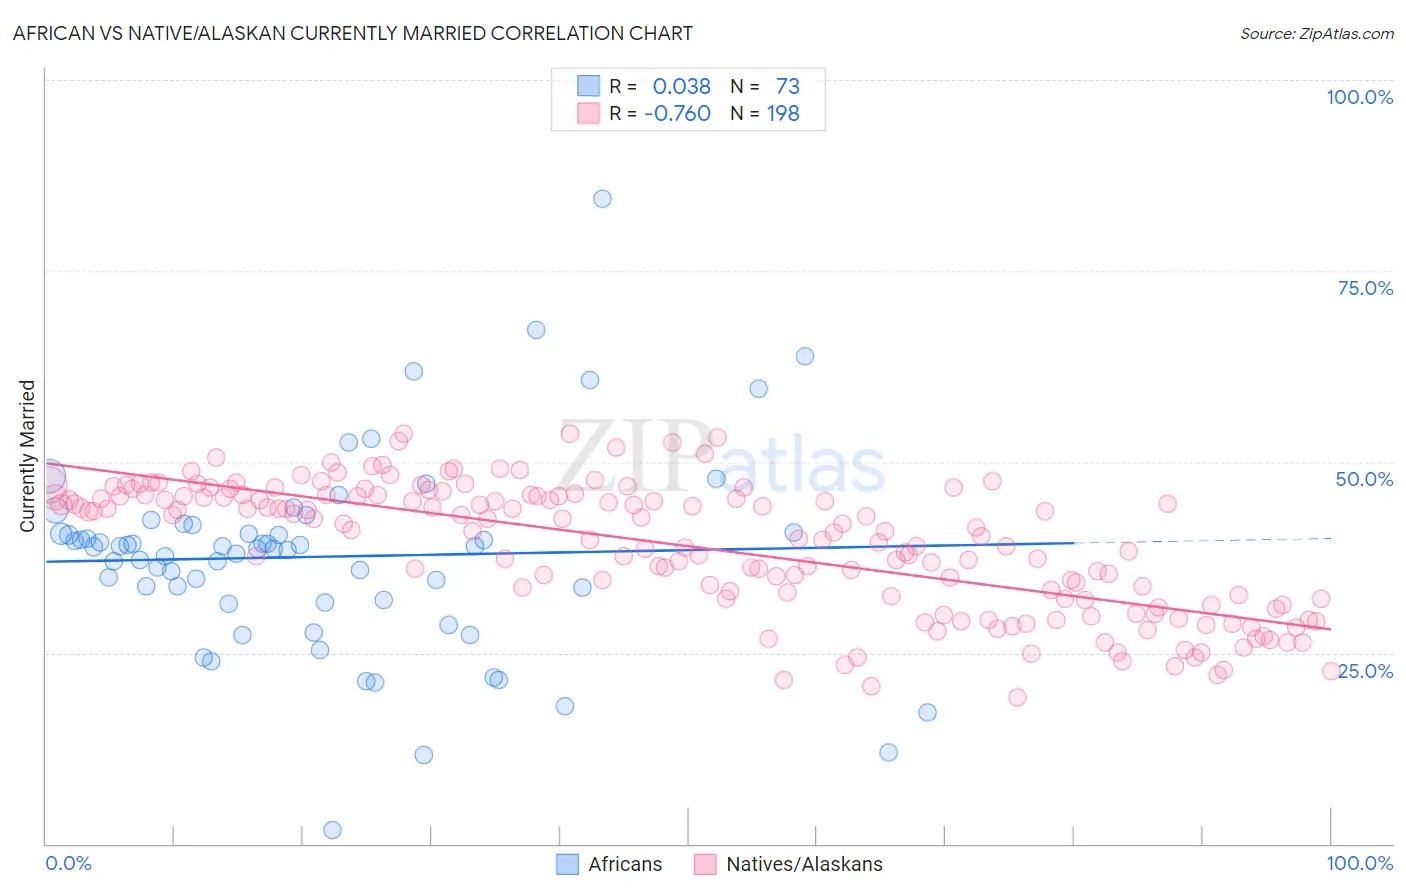
African vs Native/Alaskan Currently Married Correlation Chart
The statistical analysis conducted on geographies consisting of 470,023,481 people shows no correlation between the proportion of Africans and percentage of population currently married in the United States with a correlation coefficient (R) of 0.038 and weighted average of 41.8%. Similarly, the statistical analysis conducted on geographies consisting of 512,977,387 people shows a strong negative correlation between the proportion of Natives/Alaskans and percentage of population currently married in the United States with a correlation coefficient (R) of -0.760 and weighted average of 42.8%, a difference of 2.3%.
Currently Married Correlation Summary
| Measurement | African | Native/Alaskan |
| Minimum | 1.8% | 19.1% |
| Maximum | 84.5% | 53.7% |
| Range | 82.7% | 34.6% |
| Mean | 37.6% | 38.9% |
| Median | 38.9% | 41.0% |
| Interquartile 25% (IQ1) | 31.7% | 32.1% |
| Interquartile 75% (IQ3) | 41.2% | 45.5% |
| Interquartile Range (IQR) | 9.4% | 13.5% |
| Standard Deviation (Sample) | 12.9% | 8.3% |
| Standard Deviation (Population) | 12.8% | 8.3% |
Demographics Similar to Africans and Natives/Alaskans by Currently Married
In terms of currently married, the demographic groups most similar to Africans are Immigrants from Guyana (41.9%, a difference of 0.13%), Immigrants from Trinidad and Tobago (41.9%, a difference of 0.14%), Immigrants from Bahamas (41.9%, a difference of 0.18%), Sioux (41.9%, a difference of 0.29%), and Immigrants from Zaire (42.0%, a difference of 0.30%). Similarly, the demographic groups most similar to Natives/Alaskans are Paiute (42.7%, a difference of 0.23%), Immigrants from Ghana (42.7%, a difference of 0.24%), Guatemalan (42.9%, a difference of 0.27%), Immigrants from Guatemala (42.6%, a difference of 0.36%), and Subsaharan African (42.6%, a difference of 0.52%).
| Demographics | Rating | Rank | Currently Married |
| Guatemalans | 0.0 /100 | #287 | Tragic 42.9% |
| Natives/Alaskans | 0.0 /100 | #288 | Tragic 42.8% |
| Paiute | 0.0 /100 | #289 | Tragic 42.7% |
| Immigrants | Ghana | 0.0 /100 | #290 | Tragic 42.7% |
| Immigrants | Guatemala | 0.0 /100 | #291 | Tragic 42.6% |
| Sub-Saharan Africans | 0.0 /100 | #292 | Tragic 42.6% |
| Yuman | 0.0 /100 | #293 | Tragic 42.6% |
| Hondurans | 0.0 /100 | #294 | Tragic 42.5% |
| Immigrants | Western Africa | 0.0 /100 | #295 | Tragic 42.4% |
| Menominee | 0.0 /100 | #296 | Tragic 42.3% |
| Cheyenne | 0.0 /100 | #297 | Tragic 42.2% |
| Immigrants | Honduras | 0.0 /100 | #298 | Tragic 42.2% |
| Liberians | 0.0 /100 | #299 | Tragic 42.2% |
| Belizeans | 0.0 /100 | #300 | Tragic 42.2% |
| Immigrants | Yemen | 0.0 /100 | #301 | Tragic 42.1% |
| Immigrants | Zaire | 0.0 /100 | #302 | Tragic 42.0% |
| Sioux | 0.0 /100 | #303 | Tragic 41.9% |
| Immigrants | Bahamas | 0.0 /100 | #304 | Tragic 41.9% |
| Immigrants | Trinidad and Tobago | 0.0 /100 | #305 | Tragic 41.9% |
| Immigrants | Guyana | 0.0 /100 | #306 | Tragic 41.9% |
| Africans | 0.0 /100 | #307 | Tragic 41.8% |