Marshallese vs Native/Alaskan Currently Married
COMPARE
Marshallese
Native/Alaskan
Currently Married
Currently Married Comparison
Marshallese
Natives/Alaskans
45.5%
CURRENTLY MARRIED
7.2/ 100
METRIC RATING
212th/ 347
METRIC RANK
42.8%
CURRENTLY MARRIED
0.0/ 100
METRIC RATING
288th/ 347
METRIC RANK
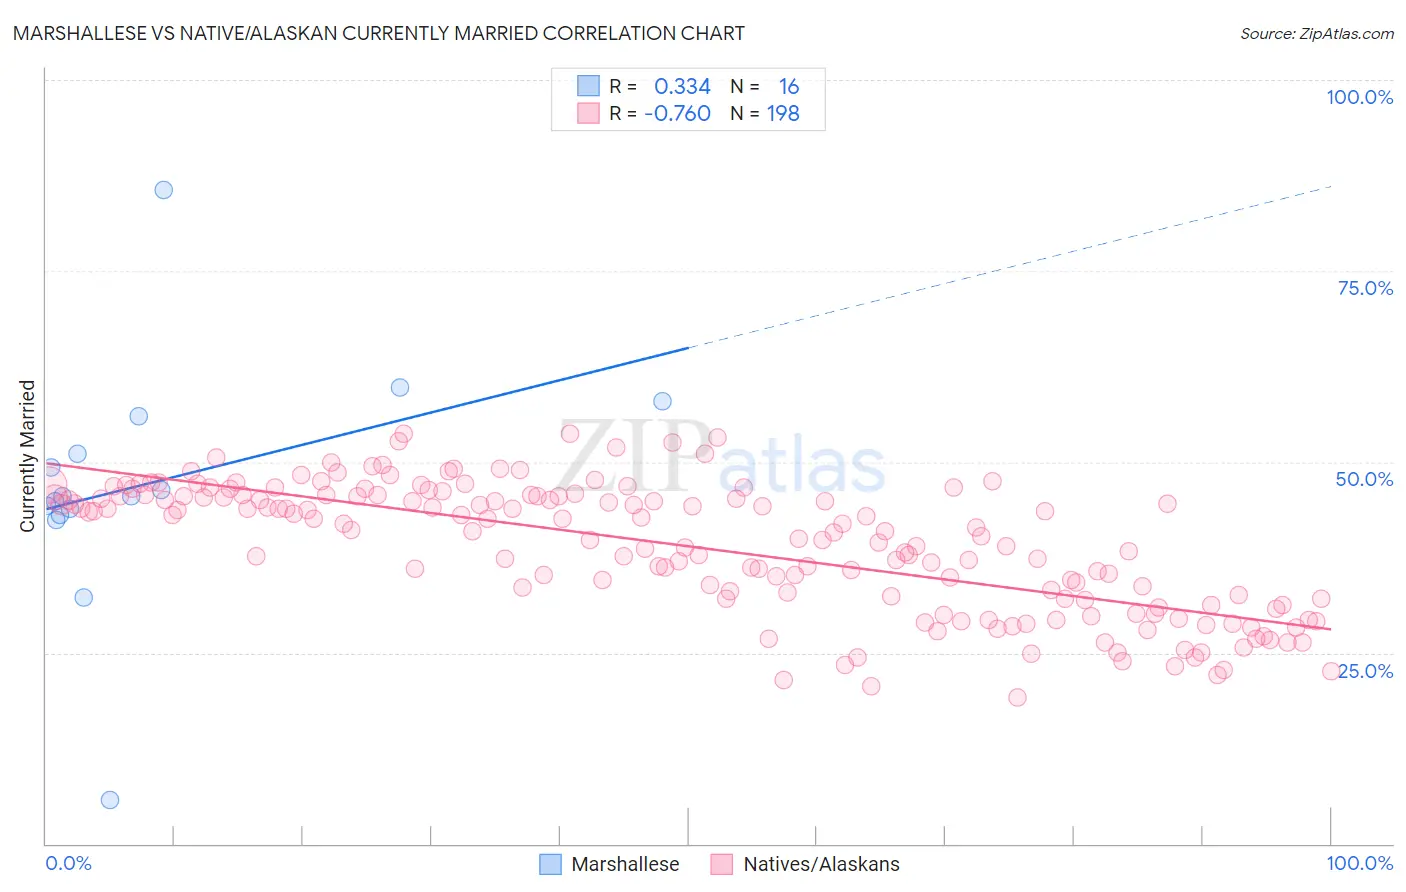
Marshallese vs Native/Alaskan Currently Married Correlation Chart
The statistical analysis conducted on geographies consisting of 14,761,315 people shows a mild positive correlation between the proportion of Marshallese and percentage of population currently married in the United States with a correlation coefficient (R) of 0.334 and weighted average of 45.5%. Similarly, the statistical analysis conducted on geographies consisting of 512,977,387 people shows a strong negative correlation between the proportion of Natives/Alaskans and percentage of population currently married in the United States with a correlation coefficient (R) of -0.760 and weighted average of 42.8%, a difference of 6.4%.
Currently Married Correlation Summary
| Measurement | Marshallese | Native/Alaskan |
| Minimum | 5.8% | 19.1% |
| Maximum | 85.6% | 53.7% |
| Range | 79.8% | 34.6% |
| Mean | 47.1% | 38.9% |
| Median | 45.5% | 41.0% |
| Interquartile 25% (IQ1) | 43.5% | 32.1% |
| Interquartile 75% (IQ3) | 53.5% | 45.5% |
| Interquartile Range (IQR) | 10.0% | 13.5% |
| Standard Deviation (Sample) | 16.0% | 8.3% |
| Standard Deviation (Population) | 15.5% | 8.3% |
Similar Demographics by Currently Married
Demographics Similar to Marshallese by Currently Married
In terms of currently married, the demographic groups most similar to Marshallese are Houma (45.5%, a difference of 0.010%), Alaska Native (45.5%, a difference of 0.030%), Dutch West Indian (45.5%, a difference of 0.070%), German Russian (45.5%, a difference of 0.070%), and Uruguayan (45.6%, a difference of 0.090%).
| Demographics | Rating | Rank | Currently Married |
| South American Indians | 11.5 /100 | #205 | Poor 45.8% |
| Immigrants | Immigrants | 11.2 /100 | #206 | Poor 45.8% |
| Immigrants | South America | 10.8 /100 | #207 | Poor 45.7% |
| Alsatians | 10.8 /100 | #208 | Poor 45.7% |
| Immigrants | Micronesia | 8.8 /100 | #209 | Tragic 45.6% |
| Uruguayans | 7.9 /100 | #210 | Tragic 45.6% |
| Houma | 7.2 /100 | #211 | Tragic 45.5% |
| Marshallese | 7.2 /100 | #212 | Tragic 45.5% |
| Alaska Natives | 7.0 /100 | #213 | Tragic 45.5% |
| Dutch West Indians | 6.7 /100 | #214 | Tragic 45.5% |
| German Russians | 6.7 /100 | #215 | Tragic 45.5% |
| Immigrants | Morocco | 5.5 /100 | #216 | Tragic 45.4% |
| Immigrants | Thailand | 5.1 /100 | #217 | Tragic 45.4% |
| Panamanians | 4.0 /100 | #218 | Tragic 45.3% |
| Immigrants | Portugal | 3.5 /100 | #219 | Tragic 45.2% |
Demographics Similar to Natives/Alaskans by Currently Married
In terms of currently married, the demographic groups most similar to Natives/Alaskans are Paiute (42.7%, a difference of 0.23%), Immigrants from Ghana (42.7%, a difference of 0.24%), Guatemalan (42.9%, a difference of 0.27%), Ghanaian (42.9%, a difference of 0.29%), and Immigrants from Guatemala (42.6%, a difference of 0.36%).
| Demographics | Rating | Rank | Currently Married |
| Chippewa | 0.0 /100 | #281 | Tragic 43.2% |
| Immigrants | Ecuador | 0.0 /100 | #282 | Tragic 43.2% |
| Kiowa | 0.0 /100 | #283 | Tragic 43.2% |
| Immigrants | El Salvador | 0.0 /100 | #284 | Tragic 43.1% |
| Immigrants | Middle Africa | 0.0 /100 | #285 | Tragic 43.0% |
| Ghanaians | 0.0 /100 | #286 | Tragic 42.9% |
| Guatemalans | 0.0 /100 | #287 | Tragic 42.9% |
| Natives/Alaskans | 0.0 /100 | #288 | Tragic 42.8% |
| Paiute | 0.0 /100 | #289 | Tragic 42.7% |
| Immigrants | Ghana | 0.0 /100 | #290 | Tragic 42.7% |
| Immigrants | Guatemala | 0.0 /100 | #291 | Tragic 42.6% |
| Sub-Saharan Africans | 0.0 /100 | #292 | Tragic 42.6% |
| Yuman | 0.0 /100 | #293 | Tragic 42.6% |
| Hondurans | 0.0 /100 | #294 | Tragic 42.5% |
| Immigrants | Western Africa | 0.0 /100 | #295 | Tragic 42.4% |