Hawaiian vs Venezuelan Currently Married
COMPARE
Hawaiian
Venezuelan
Currently Married
Currently Married Comparison
Hawaiians
Venezuelans
46.6%
CURRENTLY MARRIED
48.6/ 100
METRIC RATING
176th/ 347
METRIC RANK
47.1%
CURRENTLY MARRIED
74.4/ 100
METRIC RATING
141st/ 347
METRIC RANK
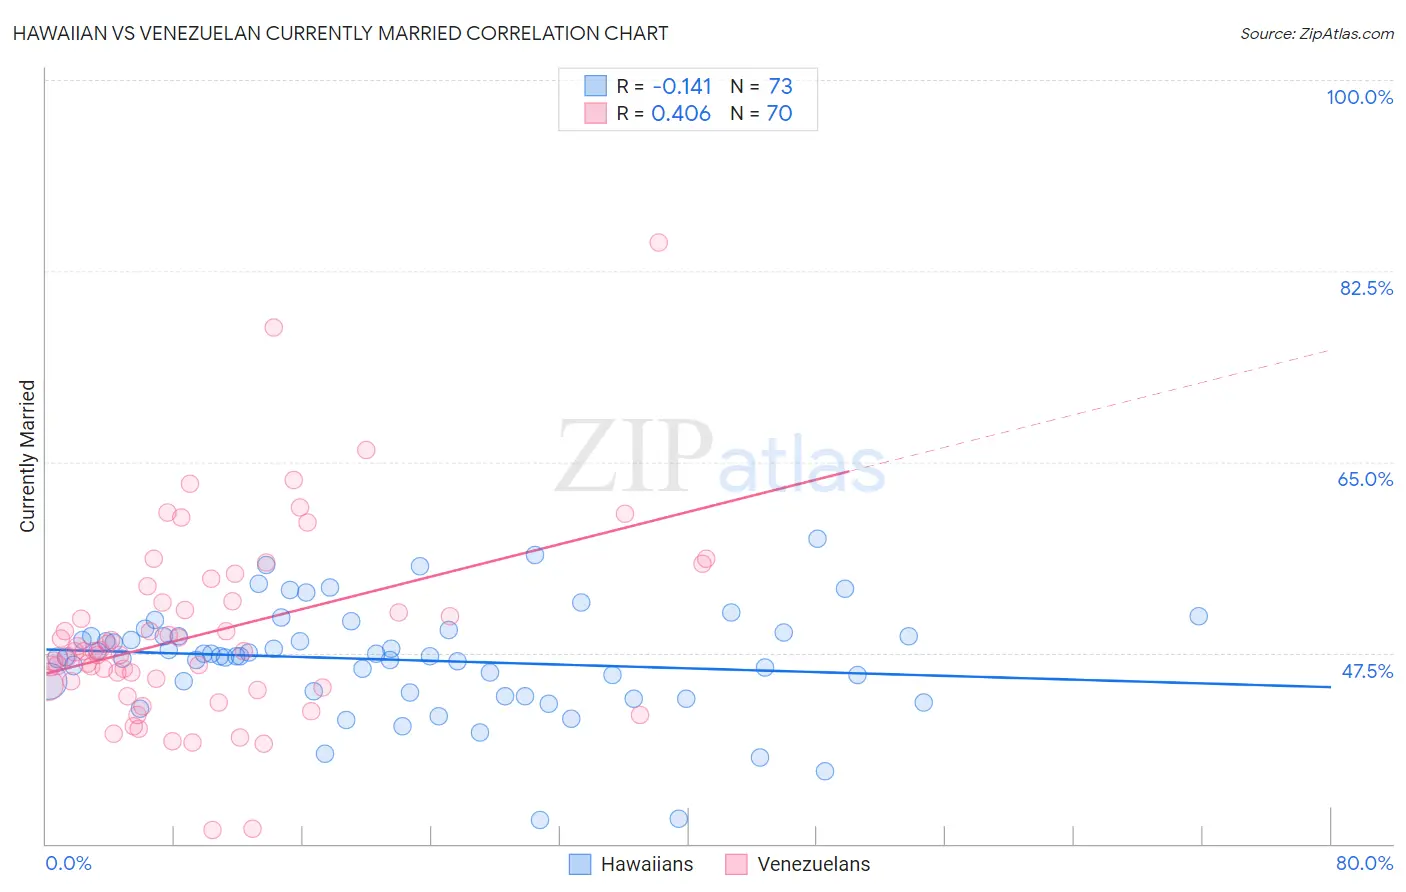
Hawaiian vs Venezuelan Currently Married Correlation Chart
The statistical analysis conducted on geographies consisting of 327,570,403 people shows a poor negative correlation between the proportion of Hawaiians and percentage of population currently married in the United States with a correlation coefficient (R) of -0.141 and weighted average of 46.6%. Similarly, the statistical analysis conducted on geographies consisting of 306,286,005 people shows a moderate positive correlation between the proportion of Venezuelans and percentage of population currently married in the United States with a correlation coefficient (R) of 0.406 and weighted average of 47.1%, a difference of 1.0%.
Currently Married Correlation Summary
| Measurement | Hawaiian | Venezuelan |
| Minimum | 32.2% | 31.2% |
| Maximum | 58.0% | 85.1% |
| Range | 25.8% | 53.9% |
| Mean | 46.9% | 49.3% |
| Median | 47.2% | 47.6% |
| Interquartile 25% (IQ1) | 43.9% | 44.5% |
| Interquartile 75% (IQ3) | 49.2% | 52.2% |
| Interquartile Range (IQR) | 5.2% | 7.7% |
| Standard Deviation (Sample) | 4.9% | 8.8% |
| Standard Deviation (Population) | 4.9% | 8.8% |
Similar Demographics by Currently Married
Demographics Similar to Hawaiians by Currently Married
In terms of currently married, the demographic groups most similar to Hawaiians are Israeli (46.6%, a difference of 0.0%), Chickasaw (46.6%, a difference of 0.030%), Peruvian (46.6%, a difference of 0.050%), Immigrants from Brazil (46.6%, a difference of 0.050%), and Tlingit-Haida (46.7%, a difference of 0.090%).
| Demographics | Rating | Rank | Currently Married |
| Armenians | 58.2 /100 | #169 | Average 46.8% |
| Immigrants | Latvia | 56.7 /100 | #170 | Average 46.7% |
| Immigrants | Zimbabwe | 52.4 /100 | #171 | Average 46.7% |
| Aleuts | 52.0 /100 | #172 | Average 46.7% |
| Tlingit-Haida | 51.2 /100 | #173 | Average 46.7% |
| Peruvians | 50.0 /100 | #174 | Average 46.6% |
| Immigrants | Brazil | 49.9 /100 | #175 | Average 46.6% |
| Hawaiians | 48.6 /100 | #176 | Average 46.6% |
| Israelis | 48.6 /100 | #177 | Average 46.6% |
| Chickasaw | 47.8 /100 | #178 | Average 46.6% |
| Immigrants | Oceania | 44.6 /100 | #179 | Average 46.5% |
| Costa Ricans | 43.7 /100 | #180 | Average 46.5% |
| Ottawa | 43.0 /100 | #181 | Average 46.5% |
| Potawatomi | 41.9 /100 | #182 | Average 46.5% |
| Immigrants | Northern Africa | 39.7 /100 | #183 | Fair 46.5% |
Demographics Similar to Venezuelans by Currently Married
In terms of currently married, the demographic groups most similar to Venezuelans are Argentinean (47.1%, a difference of 0.0%), Guamanian/Chamorro (47.1%, a difference of 0.010%), Cajun (47.1%, a difference of 0.040%), Hmong (47.1%, a difference of 0.050%), and Immigrants from South Eastern Asia (47.1%, a difference of 0.070%).
| Demographics | Rating | Rank | Currently Married |
| Immigrants | Australia | 81.1 /100 | #134 | Excellent 47.3% |
| Immigrants | Norway | 79.7 /100 | #135 | Good 47.2% |
| Immigrants | Vietnam | 78.2 /100 | #136 | Good 47.2% |
| Paraguayans | 77.8 /100 | #137 | Good 47.2% |
| Pakistanis | 77.5 /100 | #138 | Good 47.2% |
| Yugoslavians | 77.4 /100 | #139 | Good 47.2% |
| Cajuns | 75.3 /100 | #140 | Good 47.1% |
| Venezuelans | 74.4 /100 | #141 | Good 47.1% |
| Argentineans | 74.4 /100 | #142 | Good 47.1% |
| Guamanians/Chamorros | 74.2 /100 | #143 | Good 47.1% |
| Hmong | 73.4 /100 | #144 | Good 47.1% |
| Immigrants | South Eastern Asia | 72.9 /100 | #145 | Good 47.1% |
| Carpatho Rusyns | 72.6 /100 | #146 | Good 47.0% |
| Immigrants | Argentina | 72.0 /100 | #147 | Good 47.0% |
| Cambodians | 70.4 /100 | #148 | Good 47.0% |