Hawaiian vs Immigrants from Fiji Currently Married
COMPARE
Hawaiian
Immigrants from Fiji
Currently Married
Currently Married Comparison
Hawaiians
Immigrants from Fiji
46.6%
CURRENTLY MARRIED
48.6/ 100
METRIC RATING
176th/ 347
METRIC RANK
46.2%
CURRENTLY MARRIED
25.0/ 100
METRIC RATING
193rd/ 347
METRIC RANK
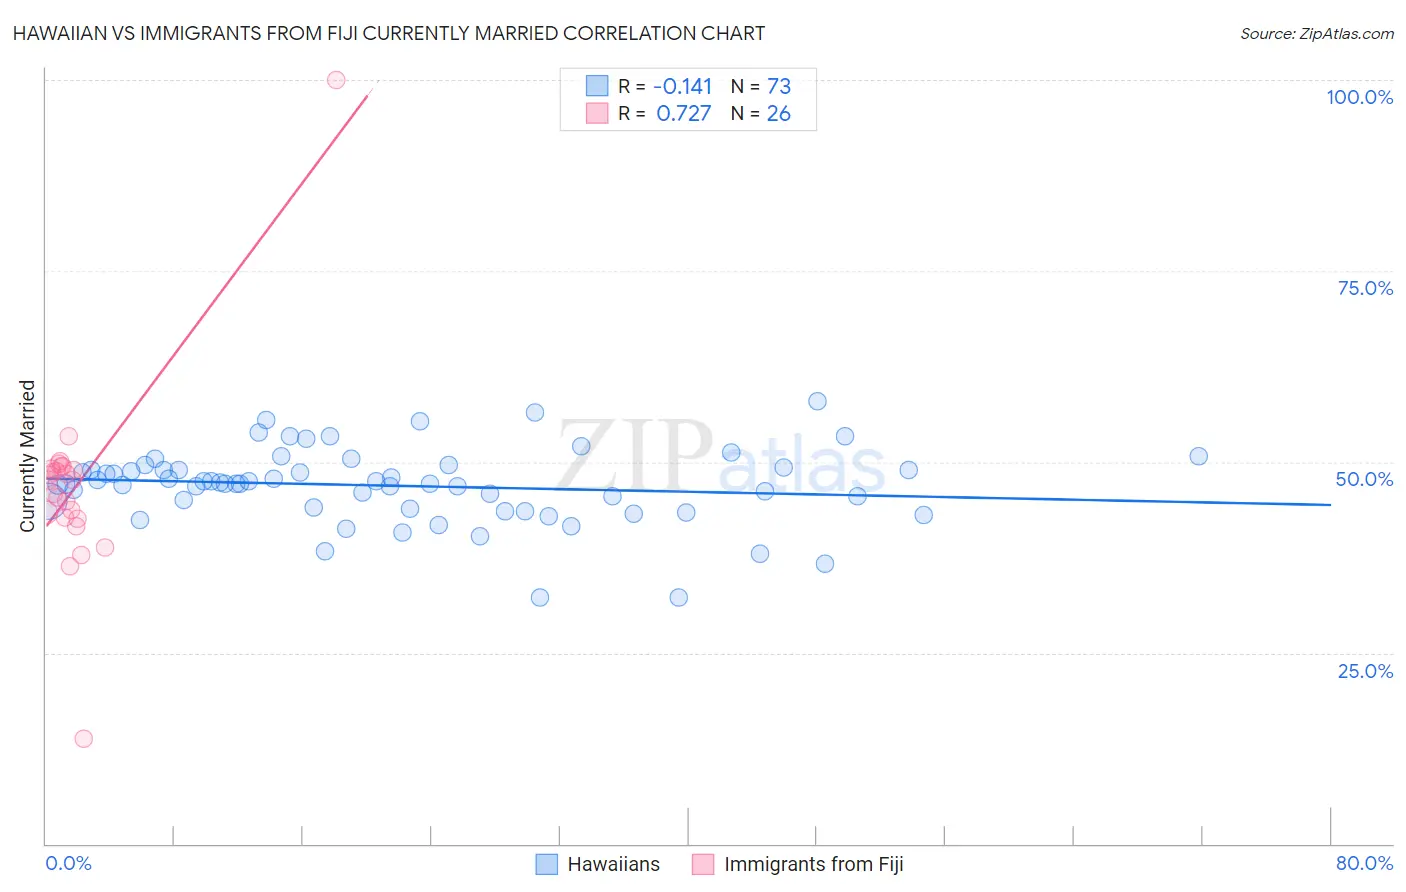
Hawaiian vs Immigrants from Fiji Currently Married Correlation Chart
The statistical analysis conducted on geographies consisting of 327,570,403 people shows a poor negative correlation between the proportion of Hawaiians and percentage of population currently married in the United States with a correlation coefficient (R) of -0.141 and weighted average of 46.6%. Similarly, the statistical analysis conducted on geographies consisting of 93,756,204 people shows a strong positive correlation between the proportion of Immigrants from Fiji and percentage of population currently married in the United States with a correlation coefficient (R) of 0.727 and weighted average of 46.2%, a difference of 0.96%.
Currently Married Correlation Summary
| Measurement | Hawaiian | Immigrants from Fiji |
| Minimum | 32.2% | 13.7% |
| Maximum | 58.0% | 100.0% |
| Range | 25.8% | 86.3% |
| Mean | 46.9% | 46.8% |
| Median | 47.2% | 47.6% |
| Interquartile 25% (IQ1) | 43.9% | 42.7% |
| Interquartile 75% (IQ3) | 49.2% | 49.1% |
| Interquartile Range (IQR) | 5.2% | 6.4% |
| Standard Deviation (Sample) | 4.9% | 13.2% |
| Standard Deviation (Population) | 4.9% | 13.0% |
Demographics Similar to Hawaiians and Immigrants from Fiji by Currently Married
In terms of currently married, the demographic groups most similar to Hawaiians are Israeli (46.6%, a difference of 0.0%), Chickasaw (46.6%, a difference of 0.030%), Peruvian (46.6%, a difference of 0.050%), Immigrants from Brazil (46.6%, a difference of 0.050%), and Immigrants from Oceania (46.5%, a difference of 0.15%). Similarly, the demographic groups most similar to Immigrants from Fiji are Soviet Union (46.2%, a difference of 0.040%), South American (46.1%, a difference of 0.060%), Immigrants from France (46.2%, a difference of 0.13%), Choctaw (46.3%, a difference of 0.19%), and Fijian (46.3%, a difference of 0.25%).
| Demographics | Rating | Rank | Currently Married |
| Peruvians | 50.0 /100 | #174 | Average 46.6% |
| Immigrants | Brazil | 49.9 /100 | #175 | Average 46.6% |
| Hawaiians | 48.6 /100 | #176 | Average 46.6% |
| Israelis | 48.6 /100 | #177 | Average 46.6% |
| Chickasaw | 47.8 /100 | #178 | Average 46.6% |
| Immigrants | Oceania | 44.6 /100 | #179 | Average 46.5% |
| Costa Ricans | 43.7 /100 | #180 | Average 46.5% |
| Ottawa | 43.0 /100 | #181 | Average 46.5% |
| Potawatomi | 41.9 /100 | #182 | Average 46.5% |
| Immigrants | Northern Africa | 39.7 /100 | #183 | Fair 46.5% |
| Brazilians | 39.3 /100 | #184 | Fair 46.4% |
| Mongolians | 37.6 /100 | #185 | Fair 46.4% |
| Immigrants | Chile | 36.8 /100 | #186 | Fair 46.4% |
| Immigrants | Peru | 35.3 /100 | #187 | Fair 46.4% |
| Colombians | 31.8 /100 | #188 | Fair 46.3% |
| Fijians | 30.3 /100 | #189 | Fair 46.3% |
| Choctaw | 29.1 /100 | #190 | Fair 46.3% |
| Immigrants | France | 27.7 /100 | #191 | Fair 46.2% |
| Soviet Union | 25.7 /100 | #192 | Fair 46.2% |
| Immigrants | Fiji | 25.0 /100 | #193 | Fair 46.2% |
| South Americans | 23.8 /100 | #194 | Fair 46.1% |