Hawaiian vs Assyrian/Chaldean/Syriac Currently Married
COMPARE
Hawaiian
Assyrian/Chaldean/Syriac
Currently Married
Currently Married Comparison
Hawaiians
Assyrians/Chaldeans/Syriacs
46.6%
CURRENTLY MARRIED
48.6/ 100
METRIC RATING
176th/ 347
METRIC RANK
50.8%
CURRENTLY MARRIED
100.0/ 100
METRIC RATING
3rd/ 347
METRIC RANK
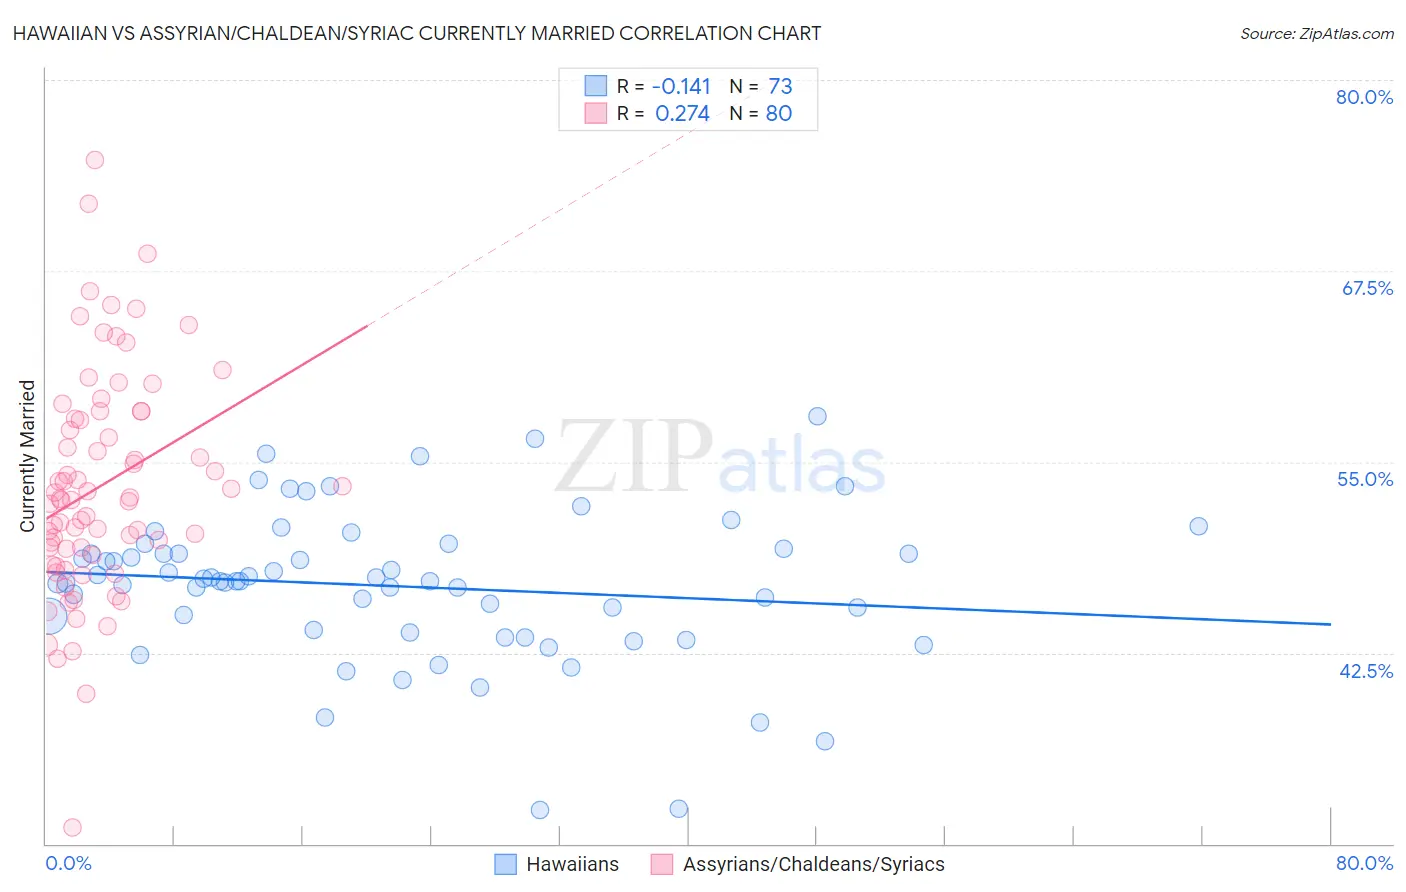
Hawaiian vs Assyrian/Chaldean/Syriac Currently Married Correlation Chart
The statistical analysis conducted on geographies consisting of 327,570,403 people shows a poor negative correlation between the proportion of Hawaiians and percentage of population currently married in the United States with a correlation coefficient (R) of -0.141 and weighted average of 46.6%. Similarly, the statistical analysis conducted on geographies consisting of 110,318,125 people shows a weak positive correlation between the proportion of Assyrians/Chaldeans/Syriacs and percentage of population currently married in the United States with a correlation coefficient (R) of 0.274 and weighted average of 50.8%, a difference of 8.9%.
Currently Married Correlation Summary
| Measurement | Hawaiian | Assyrian/Chaldean/Syriac |
| Minimum | 32.2% | 31.0% |
| Maximum | 58.0% | 74.8% |
| Range | 25.8% | 43.8% |
| Mean | 46.9% | 53.4% |
| Median | 47.2% | 52.6% |
| Interquartile 25% (IQ1) | 43.9% | 49.1% |
| Interquartile 75% (IQ3) | 49.2% | 58.1% |
| Interquartile Range (IQR) | 5.2% | 8.9% |
| Standard Deviation (Sample) | 4.9% | 7.4% |
| Standard Deviation (Population) | 4.9% | 7.3% |
Similar Demographics by Currently Married
Demographics Similar to Hawaiians by Currently Married
In terms of currently married, the demographic groups most similar to Hawaiians are Israeli (46.6%, a difference of 0.0%), Chickasaw (46.6%, a difference of 0.030%), Peruvian (46.6%, a difference of 0.050%), Immigrants from Brazil (46.6%, a difference of 0.050%), and Tlingit-Haida (46.7%, a difference of 0.090%).
| Demographics | Rating | Rank | Currently Married |
| Armenians | 58.2 /100 | #169 | Average 46.8% |
| Immigrants | Latvia | 56.7 /100 | #170 | Average 46.7% |
| Immigrants | Zimbabwe | 52.4 /100 | #171 | Average 46.7% |
| Aleuts | 52.0 /100 | #172 | Average 46.7% |
| Tlingit-Haida | 51.2 /100 | #173 | Average 46.7% |
| Peruvians | 50.0 /100 | #174 | Average 46.6% |
| Immigrants | Brazil | 49.9 /100 | #175 | Average 46.6% |
| Hawaiians | 48.6 /100 | #176 | Average 46.6% |
| Israelis | 48.6 /100 | #177 | Average 46.6% |
| Chickasaw | 47.8 /100 | #178 | Average 46.6% |
| Immigrants | Oceania | 44.6 /100 | #179 | Average 46.5% |
| Costa Ricans | 43.7 /100 | #180 | Average 46.5% |
| Ottawa | 43.0 /100 | #181 | Average 46.5% |
| Potawatomi | 41.9 /100 | #182 | Average 46.5% |
| Immigrants | Northern Africa | 39.7 /100 | #183 | Fair 46.5% |
Demographics Similar to Assyrians/Chaldeans/Syriacs by Currently Married
In terms of currently married, the demographic groups most similar to Assyrians/Chaldeans/Syriacs are Immigrants from Taiwan (50.7%, a difference of 0.080%), Thai (50.9%, a difference of 0.18%), Danish (50.5%, a difference of 0.63%), Norwegian (50.2%, a difference of 1.2%), and Immigrants from South Central Asia (50.0%, a difference of 1.5%).
| Demographics | Rating | Rank | Currently Married |
| Immigrants | India | 100.0 /100 | #1 | Exceptional 51.8% |
| Thais | 100.0 /100 | #2 | Exceptional 50.9% |
| Assyrians/Chaldeans/Syriacs | 100.0 /100 | #3 | Exceptional 50.8% |
| Immigrants | Taiwan | 100.0 /100 | #4 | Exceptional 50.7% |
| Danes | 100.0 /100 | #5 | Exceptional 50.5% |
| Norwegians | 100.0 /100 | #6 | Exceptional 50.2% |
| Immigrants | South Central Asia | 100.0 /100 | #7 | Exceptional 50.0% |
| Swedes | 100.0 /100 | #8 | Exceptional 50.0% |
| Czechs | 99.9 /100 | #9 | Exceptional 49.9% |
| Filipinos | 99.9 /100 | #10 | Exceptional 49.7% |
| English | 99.9 /100 | #11 | Exceptional 49.7% |
| Swiss | 99.9 /100 | #12 | Exceptional 49.7% |
| Dutch | 99.9 /100 | #13 | Exceptional 49.6% |
| Germans | 99.9 /100 | #14 | Exceptional 49.6% |
| Pennsylvania Germans | 99.9 /100 | #15 | Exceptional 49.6% |