Hawaiian vs Immigrants from Western Europe Currently Married
COMPARE
Hawaiian
Immigrants from Western Europe
Currently Married
Currently Married Comparison
Hawaiians
Immigrants from Western Europe
46.6%
CURRENTLY MARRIED
48.6/ 100
METRIC RATING
176th/ 347
METRIC RANK
47.6%
CURRENTLY MARRIED
91.1/ 100
METRIC RATING
112th/ 347
METRIC RANK
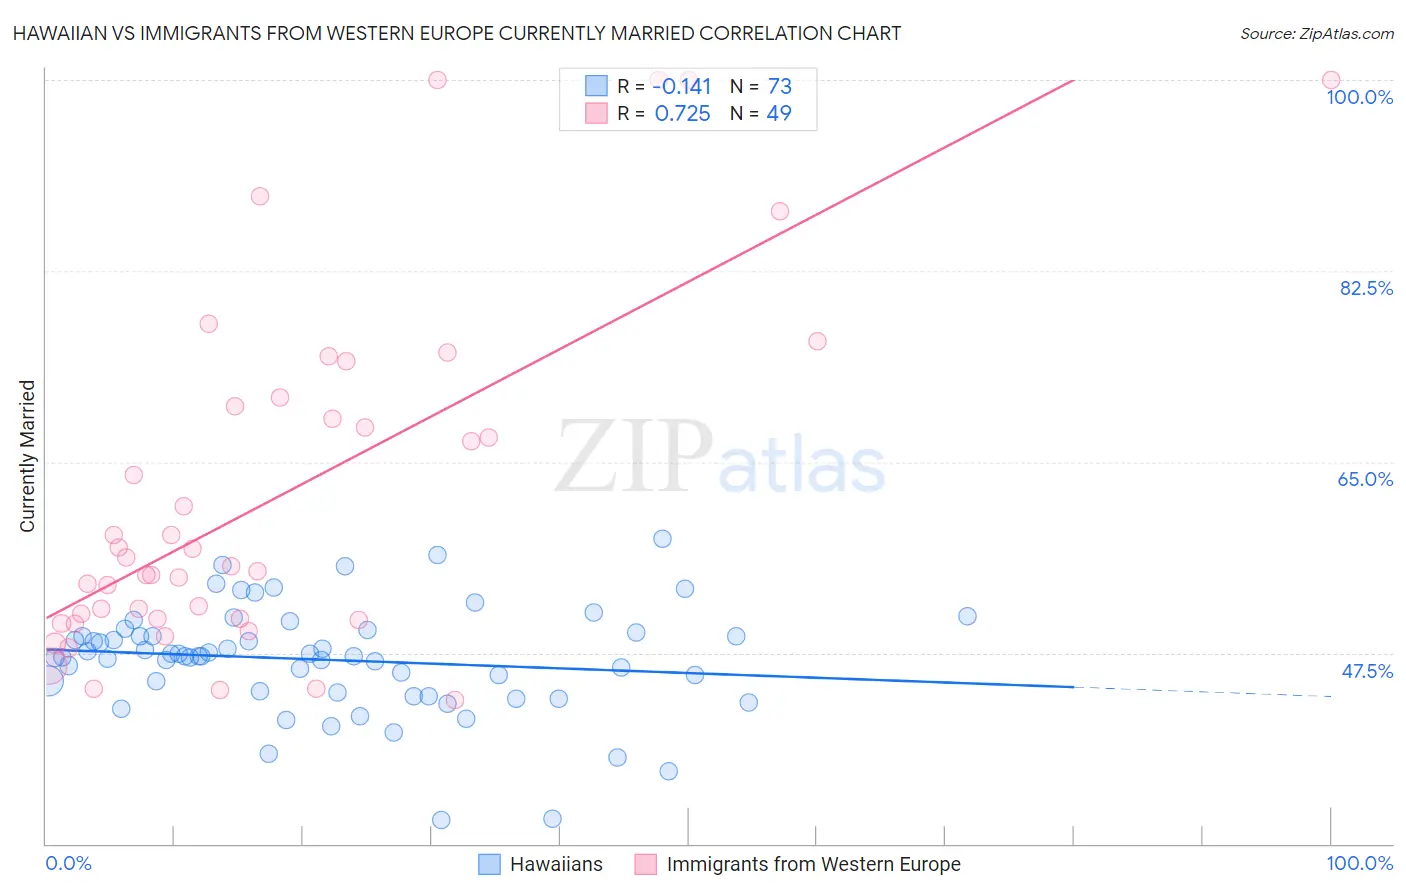
Hawaiian vs Immigrants from Western Europe Currently Married Correlation Chart
The statistical analysis conducted on geographies consisting of 327,570,403 people shows a poor negative correlation between the proportion of Hawaiians and percentage of population currently married in the United States with a correlation coefficient (R) of -0.141 and weighted average of 46.6%. Similarly, the statistical analysis conducted on geographies consisting of 494,018,358 people shows a strong positive correlation between the proportion of Immigrants from Western Europe and percentage of population currently married in the United States with a correlation coefficient (R) of 0.725 and weighted average of 47.6%, a difference of 2.2%.
Currently Married Correlation Summary
| Measurement | Hawaiian | Immigrants from Western Europe |
| Minimum | 32.2% | 43.2% |
| Maximum | 58.0% | 100.0% |
| Range | 25.8% | 56.8% |
| Mean | 46.9% | 61.9% |
| Median | 47.2% | 55.4% |
| Interquartile 25% (IQ1) | 43.9% | 50.5% |
| Interquartile 75% (IQ3) | 49.2% | 70.5% |
| Interquartile Range (IQR) | 5.2% | 19.9% |
| Standard Deviation (Sample) | 4.9% | 16.0% |
| Standard Deviation (Population) | 4.9% | 15.8% |
Similar Demographics by Currently Married
Demographics Similar to Hawaiians by Currently Married
In terms of currently married, the demographic groups most similar to Hawaiians are Israeli (46.6%, a difference of 0.0%), Chickasaw (46.6%, a difference of 0.030%), Peruvian (46.6%, a difference of 0.050%), Immigrants from Brazil (46.6%, a difference of 0.050%), and Tlingit-Haida (46.7%, a difference of 0.090%).
| Demographics | Rating | Rank | Currently Married |
| Armenians | 58.2 /100 | #169 | Average 46.8% |
| Immigrants | Latvia | 56.7 /100 | #170 | Average 46.7% |
| Immigrants | Zimbabwe | 52.4 /100 | #171 | Average 46.7% |
| Aleuts | 52.0 /100 | #172 | Average 46.7% |
| Tlingit-Haida | 51.2 /100 | #173 | Average 46.7% |
| Peruvians | 50.0 /100 | #174 | Average 46.6% |
| Immigrants | Brazil | 49.9 /100 | #175 | Average 46.6% |
| Hawaiians | 48.6 /100 | #176 | Average 46.6% |
| Israelis | 48.6 /100 | #177 | Average 46.6% |
| Chickasaw | 47.8 /100 | #178 | Average 46.6% |
| Immigrants | Oceania | 44.6 /100 | #179 | Average 46.5% |
| Costa Ricans | 43.7 /100 | #180 | Average 46.5% |
| Ottawa | 43.0 /100 | #181 | Average 46.5% |
| Potawatomi | 41.9 /100 | #182 | Average 46.5% |
| Immigrants | Northern Africa | 39.7 /100 | #183 | Fair 46.5% |
Demographics Similar to Immigrants from Western Europe by Currently Married
In terms of currently married, the demographic groups most similar to Immigrants from Western Europe are Immigrants from Hungary (47.6%, a difference of 0.010%), Immigrants from Denmark (47.6%, a difference of 0.030%), South African (47.6%, a difference of 0.060%), Immigrants from Indonesia (47.6%, a difference of 0.070%), and Palestinian (47.6%, a difference of 0.070%).
| Demographics | Rating | Rank | Currently Married |
| Immigrants | Singapore | 93.3 /100 | #105 | Exceptional 47.8% |
| Immigrants | Greece | 93.1 /100 | #106 | Exceptional 47.7% |
| Immigrants | Italy | 92.9 /100 | #107 | Exceptional 47.7% |
| Tsimshian | 92.4 /100 | #108 | Exceptional 47.7% |
| Immigrants | Egypt | 92.3 /100 | #109 | Exceptional 47.7% |
| Immigrants | Russia | 92.0 /100 | #110 | Exceptional 47.7% |
| Immigrants | Hungary | 91.2 /100 | #111 | Exceptional 47.6% |
| Immigrants | Western Europe | 91.1 /100 | #112 | Exceptional 47.6% |
| Immigrants | Denmark | 90.9 /100 | #113 | Exceptional 47.6% |
| South Africans | 90.5 /100 | #114 | Exceptional 47.6% |
| Immigrants | Indonesia | 90.5 /100 | #115 | Exceptional 47.6% |
| Palestinians | 90.4 /100 | #116 | Exceptional 47.6% |
| Puget Sound Salish | 90.3 /100 | #117 | Exceptional 47.6% |
| Immigrants | Philippines | 90.2 /100 | #118 | Exceptional 47.6% |
| Australians | 90.2 /100 | #119 | Exceptional 47.6% |