Spanish American vs Egyptian Births to Unmarried Women
COMPARE
Spanish American
Egyptian
Births to Unmarried Women
Births to Unmarried Women Comparison
Spanish Americans
Egyptians
38.6%
BIRTHS TO UNMARRIED WOMEN
0.0/ 100
METRIC RATING
299th/ 347
METRIC RANK
28.2%
BIRTHS TO UNMARRIED WOMEN
99.0/ 100
METRIC RATING
62nd/ 347
METRIC RANK
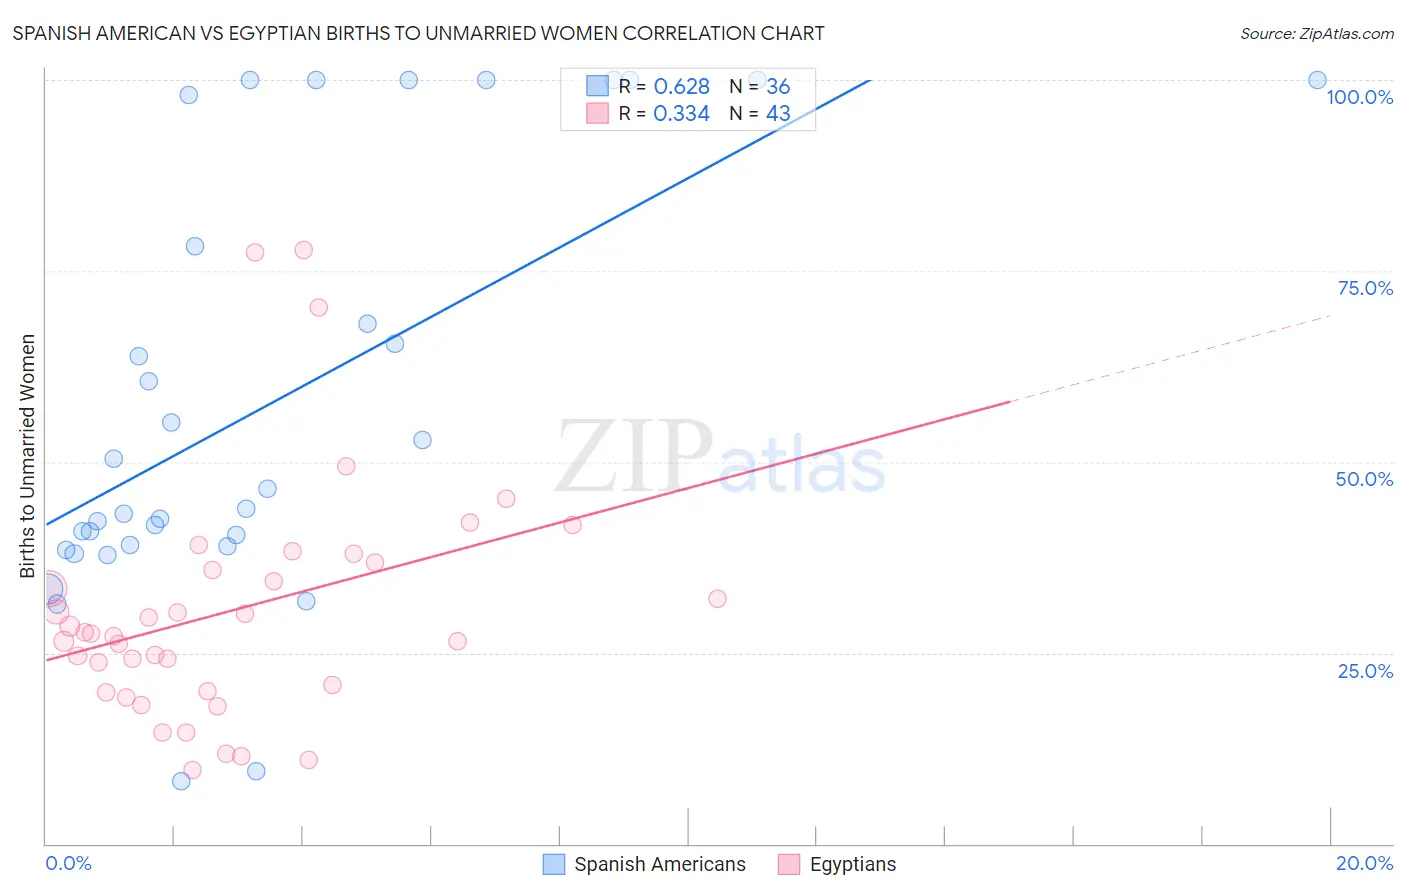
Spanish American vs Egyptian Births to Unmarried Women Correlation Chart
The statistical analysis conducted on geographies consisting of 101,589,972 people shows a significant positive correlation between the proportion of Spanish Americans and percentage of births to unmarried women in the United States with a correlation coefficient (R) of 0.628 and weighted average of 38.6%. Similarly, the statistical analysis conducted on geographies consisting of 261,953,524 people shows a mild positive correlation between the proportion of Egyptians and percentage of births to unmarried women in the United States with a correlation coefficient (R) of 0.334 and weighted average of 28.2%, a difference of 36.5%.
Births to Unmarried Women Correlation Summary
| Measurement | Spanish American | Egyptian |
| Minimum | 8.2% | 9.6% |
| Maximum | 100.0% | 77.8% |
| Range | 91.8% | 68.2% |
| Mean | 57.8% | 30.5% |
| Median | 45.1% | 27.5% |
| Interquartile 25% (IQ1) | 39.1% | 20.0% |
| Interquartile 75% (IQ3) | 88.1% | 36.9% |
| Interquartile Range (IQR) | 49.1% | 16.9% |
| Standard Deviation (Sample) | 28.0% | 15.6% |
| Standard Deviation (Population) | 27.6% | 15.4% |
Similar Demographics by Births to Unmarried Women
Demographics Similar to Spanish Americans by Births to Unmarried Women
In terms of births to unmarried women, the demographic groups most similar to Spanish Americans are Immigrants from West Indies (38.6%, a difference of 0.060%), Haitian (38.6%, a difference of 0.070%), Jamaican (38.5%, a difference of 0.20%), Honduran (38.7%, a difference of 0.31%), and Dutch West Indian (38.4%, a difference of 0.40%).
| Demographics | Rating | Rank | Births to Unmarried Women |
| Blackfeet | 0.0 /100 | #292 | Tragic 37.9% |
| Immigrants | Nicaragua | 0.0 /100 | #293 | Tragic 38.0% |
| British West Indians | 0.0 /100 | #294 | Tragic 38.0% |
| Iroquois | 0.0 /100 | #295 | Tragic 38.2% |
| Alaska Natives | 0.0 /100 | #296 | Tragic 38.3% |
| Dutch West Indians | 0.0 /100 | #297 | Tragic 38.4% |
| Jamaicans | 0.0 /100 | #298 | Tragic 38.5% |
| Spanish Americans | 0.0 /100 | #299 | Tragic 38.6% |
| Immigrants | West Indies | 0.0 /100 | #300 | Tragic 38.6% |
| Haitians | 0.0 /100 | #301 | Tragic 38.6% |
| Hondurans | 0.0 /100 | #302 | Tragic 38.7% |
| Immigrants | Jamaica | 0.0 /100 | #303 | Tragic 38.8% |
| Yaqui | 0.0 /100 | #304 | Tragic 38.8% |
| Immigrants | Haiti | 0.0 /100 | #305 | Tragic 38.9% |
| Central American Indians | 0.0 /100 | #306 | Tragic 39.0% |
Demographics Similar to Egyptians by Births to Unmarried Women
In terms of births to unmarried women, the demographic groups most similar to Egyptians are Immigrants from Serbia (28.3%, a difference of 0.14%), Immigrants from North Macedonia (28.1%, a difference of 0.32%), Immigrants from Turkey (28.1%, a difference of 0.36%), Immigrants from Kazakhstan (28.1%, a difference of 0.41%), and Tongan (28.4%, a difference of 0.53%).
| Demographics | Rating | Rank | Births to Unmarried Women |
| Mongolians | 99.3 /100 | #55 | Exceptional 27.9% |
| Immigrants | Belgium | 99.3 /100 | #56 | Exceptional 28.0% |
| Russians | 99.2 /100 | #57 | Exceptional 28.0% |
| Immigrants | Albania | 99.2 /100 | #58 | Exceptional 28.0% |
| Immigrants | Kazakhstan | 99.1 /100 | #59 | Exceptional 28.1% |
| Immigrants | Turkey | 99.1 /100 | #60 | Exceptional 28.1% |
| Immigrants | North Macedonia | 99.1 /100 | #61 | Exceptional 28.1% |
| Egyptians | 99.0 /100 | #62 | Exceptional 28.2% |
| Immigrants | Serbia | 98.9 /100 | #63 | Exceptional 28.3% |
| Tongans | 98.8 /100 | #64 | Exceptional 28.4% |
| Immigrants | Czechoslovakia | 98.8 /100 | #65 | Exceptional 28.4% |
| Immigrants | Egypt | 98.8 /100 | #66 | Exceptional 28.4% |
| Palestinians | 98.7 /100 | #67 | Exceptional 28.4% |
| Immigrants | Europe | 98.7 /100 | #68 | Exceptional 28.4% |
| Bolivians | 98.7 /100 | #69 | Exceptional 28.5% |