Immigrants from Northern Africa vs Egyptian Births to Unmarried Women
COMPARE
Immigrants from Northern Africa
Egyptian
Births to Unmarried Women
Births to Unmarried Women Comparison
Immigrants from Northern Africa
Egyptians
29.5%
BIRTHS TO UNMARRIED WOMEN
94.7/ 100
METRIC RATING
101st/ 347
METRIC RANK
28.2%
BIRTHS TO UNMARRIED WOMEN
99.0/ 100
METRIC RATING
62nd/ 347
METRIC RANK
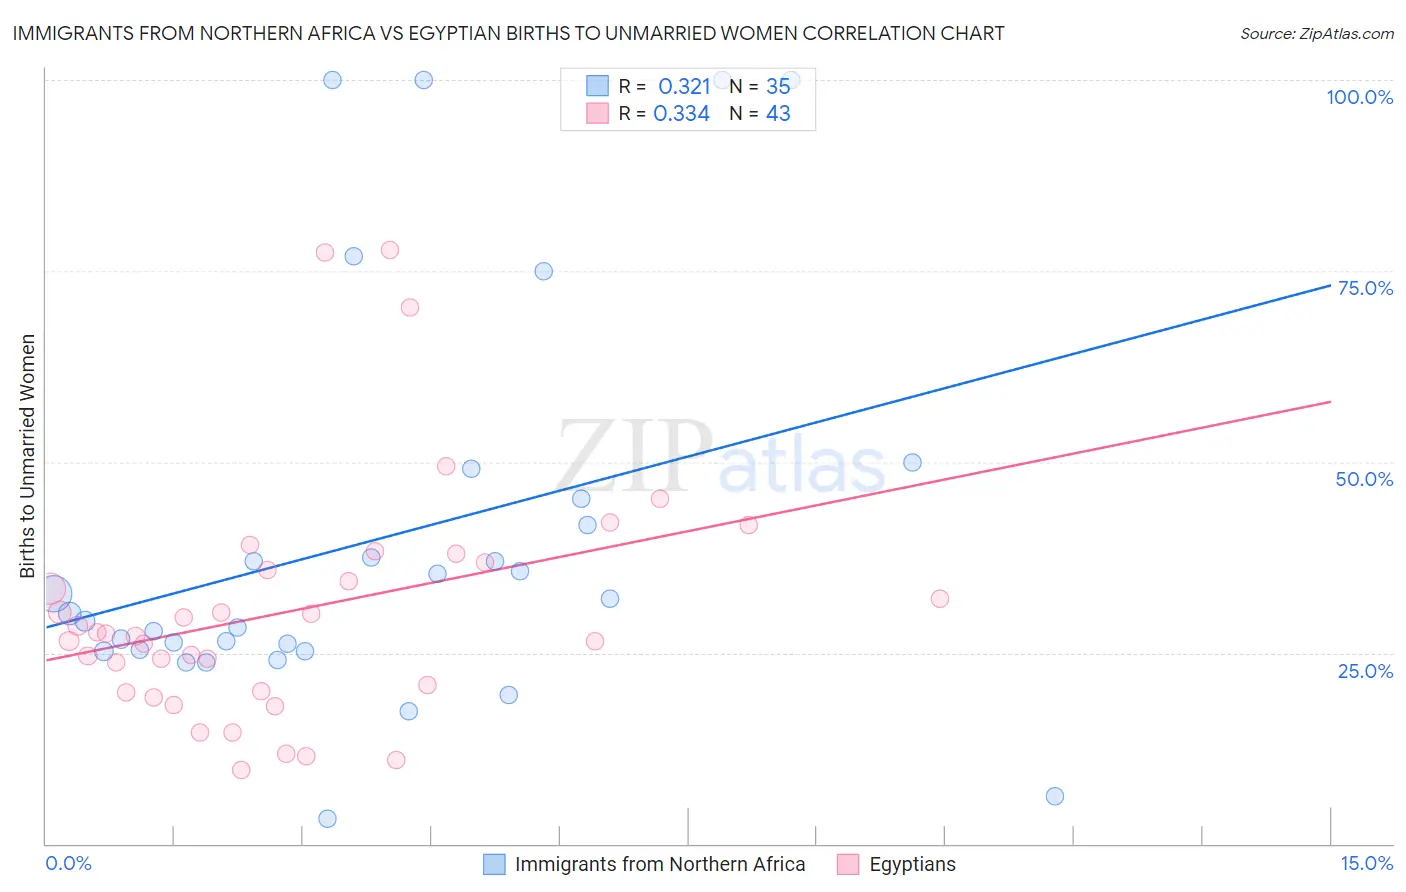
Immigrants from Northern Africa vs Egyptian Births to Unmarried Women Correlation Chart
The statistical analysis conducted on geographies consisting of 302,719,907 people shows a mild positive correlation between the proportion of Immigrants from Northern Africa and percentage of births to unmarried women in the United States with a correlation coefficient (R) of 0.321 and weighted average of 29.5%. Similarly, the statistical analysis conducted on geographies consisting of 261,953,524 people shows a mild positive correlation between the proportion of Egyptians and percentage of births to unmarried women in the United States with a correlation coefficient (R) of 0.334 and weighted average of 28.2%, a difference of 4.5%.
Births to Unmarried Women Correlation Summary
| Measurement | Immigrants from Northern Africa | Egyptian |
| Minimum | 3.2% | 9.6% |
| Maximum | 100.0% | 77.8% |
| Range | 96.8% | 68.2% |
| Mean | 40.0% | 30.5% |
| Median | 30.2% | 27.5% |
| Interquartile 25% (IQ1) | 25.3% | 20.0% |
| Interquartile 75% (IQ3) | 45.1% | 36.9% |
| Interquartile Range (IQR) | 19.8% | 16.9% |
| Standard Deviation (Sample) | 26.3% | 15.6% |
| Standard Deviation (Population) | 25.9% | 15.4% |
Similar Demographics by Births to Unmarried Women
Demographics Similar to Immigrants from Northern Africa by Births to Unmarried Women
In terms of births to unmarried women, the demographic groups most similar to Immigrants from Northern Africa are Australian (29.5%, a difference of 0.080%), Lebanese (29.5%, a difference of 0.13%), Lithuanian (29.6%, a difference of 0.14%), Immigrants from Nepal (29.6%, a difference of 0.19%), and Immigrants from Denmark (29.4%, a difference of 0.29%).
| Demographics | Rating | Rank | Births to Unmarried Women |
| Ukrainians | 96.3 /100 | #94 | Exceptional 29.2% |
| Immigrants | Vietnam | 96.1 /100 | #95 | Exceptional 29.3% |
| Norwegians | 95.8 /100 | #96 | Exceptional 29.3% |
| Immigrants | South Africa | 95.7 /100 | #97 | Exceptional 29.3% |
| Immigrants | Syria | 95.7 /100 | #98 | Exceptional 29.4% |
| Immigrants | Denmark | 95.3 /100 | #99 | Exceptional 29.4% |
| Luxembourgers | 95.2 /100 | #100 | Exceptional 29.4% |
| Immigrants | Northern Africa | 94.7 /100 | #101 | Exceptional 29.5% |
| Australians | 94.6 /100 | #102 | Exceptional 29.5% |
| Lebanese | 94.4 /100 | #103 | Exceptional 29.5% |
| Lithuanians | 94.4 /100 | #104 | Exceptional 29.6% |
| Immigrants | Nepal | 94.3 /100 | #105 | Exceptional 29.6% |
| Swedes | 93.8 /100 | #106 | Exceptional 29.6% |
| Immigrants | Brazil | 93.7 /100 | #107 | Exceptional 29.6% |
| Paraguayans | 93.5 /100 | #108 | Exceptional 29.7% |
Demographics Similar to Egyptians by Births to Unmarried Women
In terms of births to unmarried women, the demographic groups most similar to Egyptians are Immigrants from Serbia (28.3%, a difference of 0.14%), Immigrants from North Macedonia (28.1%, a difference of 0.32%), Immigrants from Turkey (28.1%, a difference of 0.36%), Immigrants from Kazakhstan (28.1%, a difference of 0.41%), and Tongan (28.4%, a difference of 0.53%).
| Demographics | Rating | Rank | Births to Unmarried Women |
| Mongolians | 99.3 /100 | #55 | Exceptional 27.9% |
| Immigrants | Belgium | 99.3 /100 | #56 | Exceptional 28.0% |
| Russians | 99.2 /100 | #57 | Exceptional 28.0% |
| Immigrants | Albania | 99.2 /100 | #58 | Exceptional 28.0% |
| Immigrants | Kazakhstan | 99.1 /100 | #59 | Exceptional 28.1% |
| Immigrants | Turkey | 99.1 /100 | #60 | Exceptional 28.1% |
| Immigrants | North Macedonia | 99.1 /100 | #61 | Exceptional 28.1% |
| Egyptians | 99.0 /100 | #62 | Exceptional 28.2% |
| Immigrants | Serbia | 98.9 /100 | #63 | Exceptional 28.3% |
| Tongans | 98.8 /100 | #64 | Exceptional 28.4% |
| Immigrants | Czechoslovakia | 98.8 /100 | #65 | Exceptional 28.4% |
| Immigrants | Egypt | 98.8 /100 | #66 | Exceptional 28.4% |
| Palestinians | 98.7 /100 | #67 | Exceptional 28.4% |
| Immigrants | Europe | 98.7 /100 | #68 | Exceptional 28.4% |
| Bolivians | 98.7 /100 | #69 | Exceptional 28.5% |