Hawaiian vs Egyptian 6th Grade
COMPARE
Hawaiian
Egyptian
6th Grade
6th Grade Comparison
Hawaiians
Egyptians
96.9%
6TH GRADE
27.0/ 100
METRIC RATING
192nd/ 347
METRIC RANK
97.1%
6TH GRADE
50.9/ 100
METRIC RATING
172nd/ 347
METRIC RANK
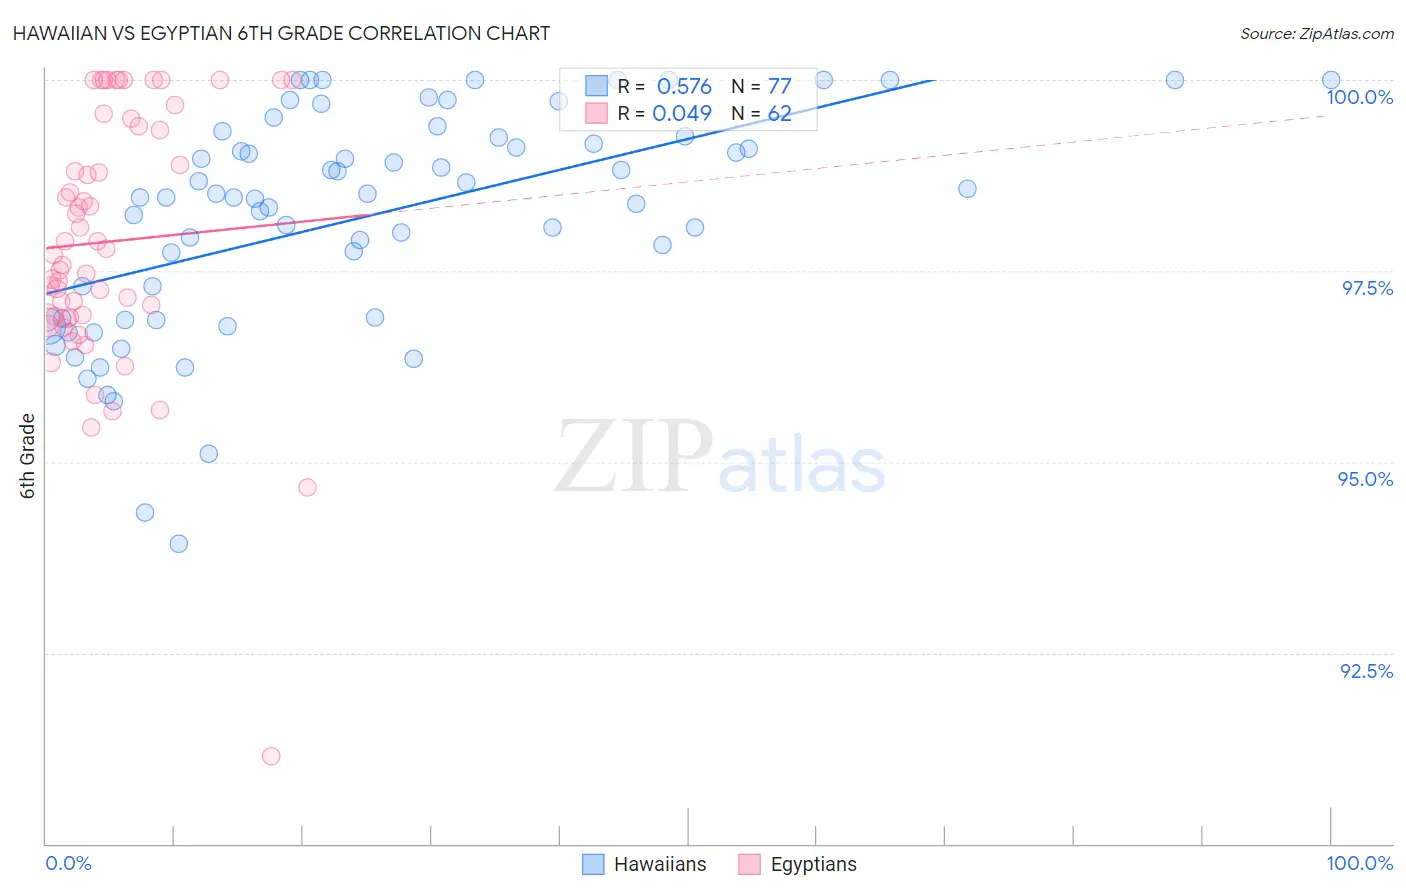
Hawaiian vs Egyptian 6th Grade Correlation Chart
The statistical analysis conducted on geographies consisting of 327,621,279 people shows a substantial positive correlation between the proportion of Hawaiians and percentage of population with at least 6th grade education in the United States with a correlation coefficient (R) of 0.576 and weighted average of 96.9%. Similarly, the statistical analysis conducted on geographies consisting of 276,927,423 people shows no correlation between the proportion of Egyptians and percentage of population with at least 6th grade education in the United States with a correlation coefficient (R) of 0.049 and weighted average of 97.1%, a difference of 0.12%.
6th Grade Correlation Summary
| Measurement | Hawaiian | Egyptian |
| Minimum | 93.9% | 91.1% |
| Maximum | 100.0% | 100.0% |
| Range | 6.1% | 8.9% |
| Mean | 98.2% | 97.9% |
| Median | 98.5% | 97.8% |
| Interquartile 25% (IQ1) | 96.9% | 96.9% |
| Interquartile 75% (IQ3) | 99.3% | 99.4% |
| Interquartile Range (IQR) | 2.4% | 2.5% |
| Standard Deviation (Sample) | 1.4% | 1.7% |
| Standard Deviation (Population) | 1.4% | 1.7% |
Demographics Similar to Hawaiians and Egyptians by 6th Grade
In terms of 6th grade, the demographic groups most similar to Hawaiians are Panamanian (96.9%, a difference of 0.0%), Dutch West Indian (96.9%, a difference of 0.010%), Immigrants from Egypt (97.0%, a difference of 0.020%), Guamanian/Chamorro (97.0%, a difference of 0.020%), and Immigrants from Argentina (97.0%, a difference of 0.020%). Similarly, the demographic groups most similar to Egyptians are Arab (97.0%, a difference of 0.0%), Venezuelan (97.0%, a difference of 0.0%), Immigrants from Kazakhstan (97.0%, a difference of 0.020%), Immigrants from Micronesia (97.0%, a difference of 0.020%), and Mongolian (97.0%, a difference of 0.020%).
| Demographics | Rating | Rank | 6th Grade |
| Egyptians | 50.9 /100 | #172 | Average 97.1% |
| Arabs | 50.1 /100 | #173 | Average 97.0% |
| Venezuelans | 50.0 /100 | #174 | Average 97.0% |
| Immigrants | Kazakhstan | 47.3 /100 | #175 | Average 97.0% |
| Immigrants | Micronesia | 47.1 /100 | #176 | Average 97.0% |
| Mongolians | 46.7 /100 | #177 | Average 97.0% |
| Pakistanis | 46.0 /100 | #178 | Average 97.0% |
| Immigrants | Kenya | 45.3 /100 | #179 | Average 97.0% |
| Immigrants | Spain | 39.9 /100 | #180 | Fair 97.0% |
| Comanche | 37.9 /100 | #181 | Fair 97.0% |
| Immigrants | Ukraine | 35.6 /100 | #182 | Fair 97.0% |
| Immigrants | Venezuela | 34.5 /100 | #183 | Fair 97.0% |
| Spanish Americans | 33.5 /100 | #184 | Fair 97.0% |
| Argentineans | 33.0 /100 | #185 | Fair 97.0% |
| Immigrants | Egypt | 31.4 /100 | #186 | Fair 97.0% |
| Guamanians/Chamorros | 30.6 /100 | #187 | Fair 97.0% |
| Immigrants | Argentina | 30.4 /100 | #188 | Fair 97.0% |
| Blacks/African Americans | 30.2 /100 | #189 | Fair 97.0% |
| Dutch West Indians | 28.3 /100 | #190 | Fair 96.9% |
| Panamanians | 27.3 /100 | #191 | Fair 96.9% |
| Hawaiians | 27.0 /100 | #192 | Fair 96.9% |