Haitian vs Immigrants from Belarus Single Father Households
COMPARE
Haitian
Immigrants from Belarus
Single Father Households
Single Father Households Comparison
Haitians
Immigrants from Belarus
2.6%
SINGLE FATHER HOUSEHOLDS
0.4/ 100
METRIC RATING
268th/ 347
METRIC RANK
1.9%
SINGLE FATHER HOUSEHOLDS
100.0/ 100
METRIC RATING
11th/ 347
METRIC RANK
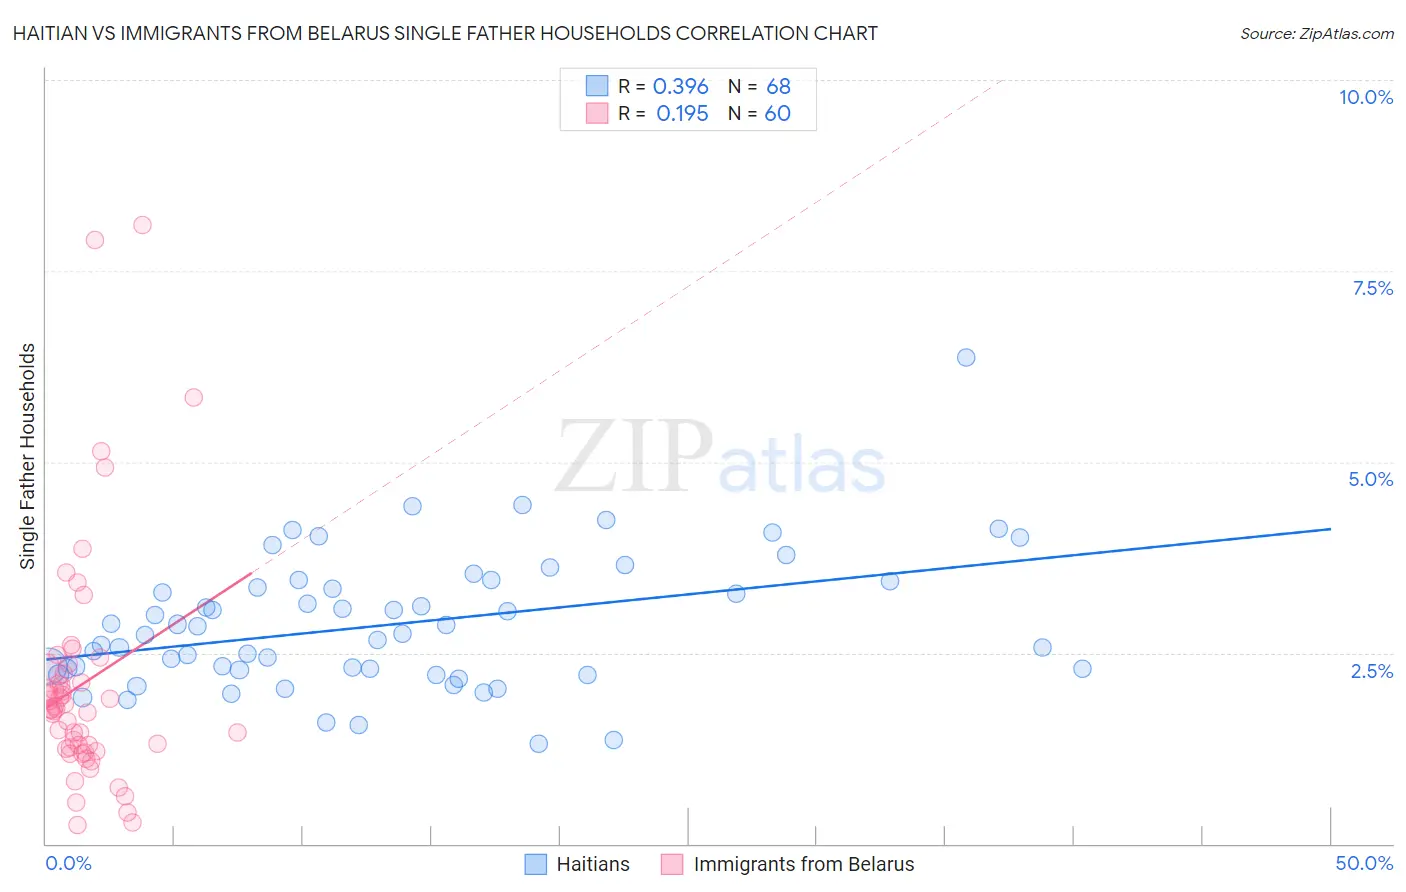
Haitian vs Immigrants from Belarus Single Father Households Correlation Chart
The statistical analysis conducted on geographies consisting of 285,939,112 people shows a mild positive correlation between the proportion of Haitians and percentage of single father households in the United States with a correlation coefficient (R) of 0.396 and weighted average of 2.6%. Similarly, the statistical analysis conducted on geographies consisting of 149,894,019 people shows a poor positive correlation between the proportion of Immigrants from Belarus and percentage of single father households in the United States with a correlation coefficient (R) of 0.195 and weighted average of 1.9%, a difference of 38.8%.
Single Father Households Correlation Summary
| Measurement | Haitian | Immigrants from Belarus |
| Minimum | 1.3% | 0.25% |
| Maximum | 6.4% | 8.1% |
| Range | 5.1% | 7.9% |
| Mean | 2.9% | 2.1% |
| Median | 2.7% | 1.8% |
| Interquartile 25% (IQ1) | 2.3% | 1.2% |
| Interquartile 75% (IQ3) | 3.4% | 2.3% |
| Interquartile Range (IQR) | 1.1% | 1.0% |
| Standard Deviation (Sample) | 0.88% | 1.5% |
| Standard Deviation (Population) | 0.87% | 1.5% |
Similar Demographics by Single Father Households
Demographics Similar to Haitians by Single Father Households
In terms of single father households, the demographic groups most similar to Haitians are Guamanian/Chamorro (2.6%, a difference of 0.040%), Cuban (2.6%, a difference of 0.34%), Seminole (2.6%, a difference of 0.48%), French American Indian (2.6%, a difference of 0.52%), and Immigrants from Micronesia (2.6%, a difference of 0.56%).
| Demographics | Rating | Rank | Single Father Households |
| Immigrants | Belize | 0.9 /100 | #261 | Tragic 2.5% |
| Immigrants | Liberia | 0.8 /100 | #262 | Tragic 2.5% |
| Dominicans | 0.8 /100 | #263 | Tragic 2.5% |
| Indonesians | 0.5 /100 | #264 | Tragic 2.6% |
| Immigrants | Micronesia | 0.5 /100 | #265 | Tragic 2.6% |
| French American Indians | 0.5 /100 | #266 | Tragic 2.6% |
| Guamanians/Chamorros | 0.4 /100 | #267 | Tragic 2.6% |
| Haitians | 0.4 /100 | #268 | Tragic 2.6% |
| Cubans | 0.3 /100 | #269 | Tragic 2.6% |
| Seminole | 0.3 /100 | #270 | Tragic 2.6% |
| Creek | 0.2 /100 | #271 | Tragic 2.6% |
| Belizeans | 0.2 /100 | #272 | Tragic 2.6% |
| Iroquois | 0.2 /100 | #273 | Tragic 2.6% |
| Puerto Ricans | 0.2 /100 | #274 | Tragic 2.6% |
| Immigrants | Dominican Republic | 0.2 /100 | #275 | Tragic 2.6% |
Demographics Similar to Immigrants from Belarus by Single Father Households
In terms of single father households, the demographic groups most similar to Immigrants from Belarus are Okinawan (1.9%, a difference of 0.32%), Immigrants from Greece (1.9%, a difference of 0.44%), Immigrants from Singapore (1.9%, a difference of 0.47%), Immigrants from China (1.8%, a difference of 0.68%), and Immigrants from Ireland (1.8%, a difference of 0.82%).
| Demographics | Rating | Rank | Single Father Households |
| Immigrants | Uzbekistan | 100.0 /100 | #4 | Exceptional 1.8% |
| Immigrants | Hong Kong | 100.0 /100 | #5 | Exceptional 1.8% |
| Immigrants | Taiwan | 100.0 /100 | #6 | Exceptional 1.8% |
| Cypriots | 100.0 /100 | #7 | Exceptional 1.8% |
| Immigrants | Ireland | 100.0 /100 | #8 | Exceptional 1.8% |
| Immigrants | China | 100.0 /100 | #9 | Exceptional 1.8% |
| Okinawans | 100.0 /100 | #10 | Exceptional 1.9% |
| Immigrants | Belarus | 100.0 /100 | #11 | Exceptional 1.9% |
| Immigrants | Greece | 100.0 /100 | #12 | Exceptional 1.9% |
| Immigrants | Singapore | 100.0 /100 | #13 | Exceptional 1.9% |
| Immigrants | Lithuania | 100.0 /100 | #14 | Exceptional 1.9% |
| Immigrants | Eastern Asia | 100.0 /100 | #15 | Exceptional 1.9% |
| Immigrants | Iran | 100.0 /100 | #16 | Exceptional 1.9% |
| Immigrants | India | 100.0 /100 | #17 | Exceptional 1.9% |
| Indians (Asian) | 100.0 /100 | #18 | Exceptional 1.9% |