Haitian vs Immigrants from Belarus Hearing Disability
COMPARE
Haitian
Immigrants from Belarus
Hearing Disability
Hearing Disability Comparison
Haitians
Immigrants from Belarus
2.6%
HEARING DISABILITY
99.5/ 100
METRIC RATING
40th/ 347
METRIC RANK
2.8%
HEARING DISABILITY
91.6/ 100
METRIC RATING
113th/ 347
METRIC RANK
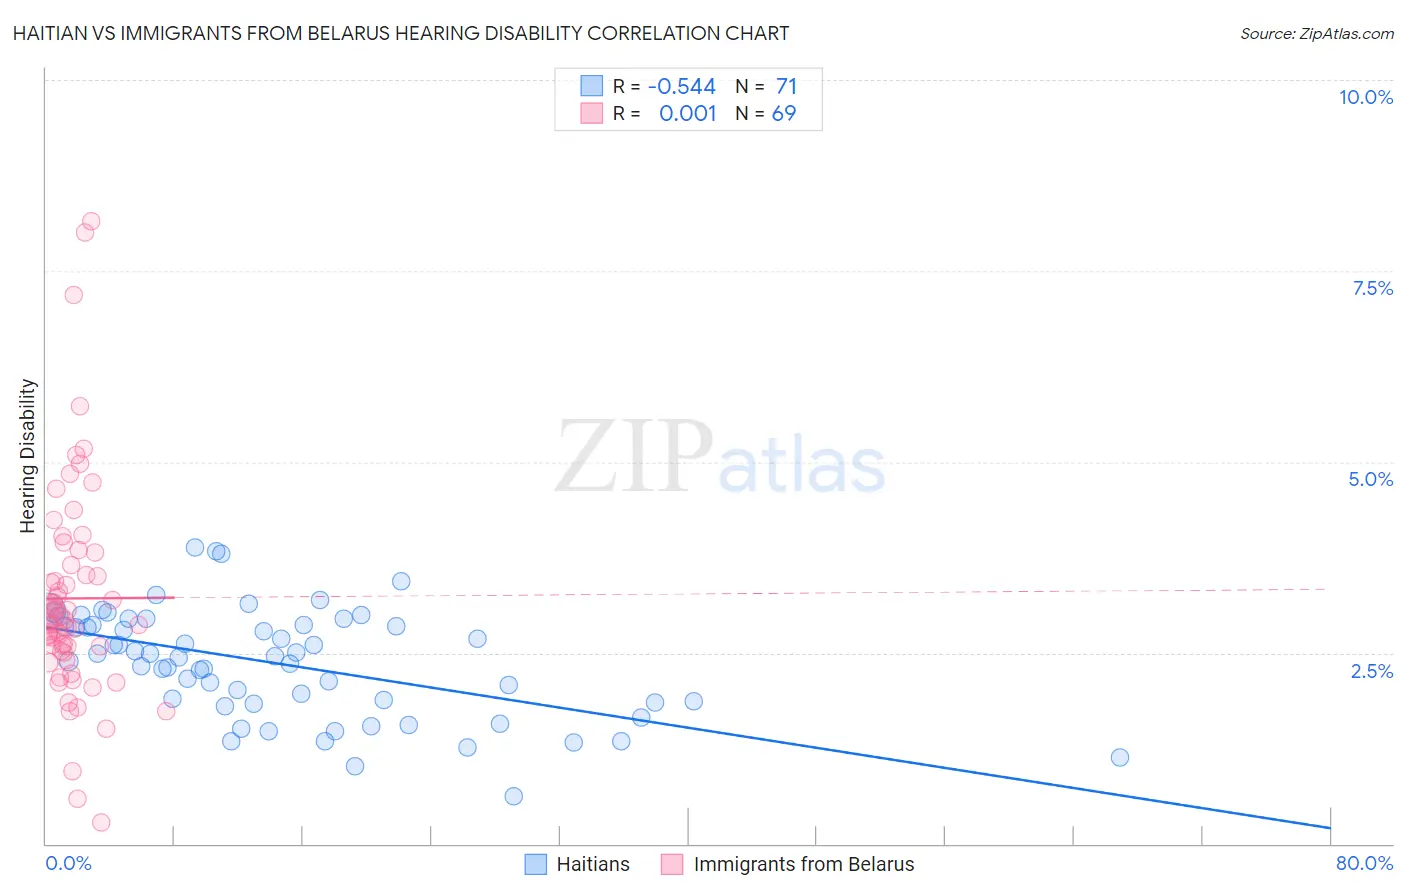
Haitian vs Immigrants from Belarus Hearing Disability Correlation Chart
The statistical analysis conducted on geographies consisting of 287,794,704 people shows a substantial negative correlation between the proportion of Haitians and percentage of population with hearing disability in the United States with a correlation coefficient (R) of -0.544 and weighted average of 2.6%. Similarly, the statistical analysis conducted on geographies consisting of 150,178,365 people shows no correlation between the proportion of Immigrants from Belarus and percentage of population with hearing disability in the United States with a correlation coefficient (R) of 0.001 and weighted average of 2.8%, a difference of 7.7%.
Hearing Disability Correlation Summary
| Measurement | Haitian | Immigrants from Belarus |
| Minimum | 0.62% | 0.28% |
| Maximum | 3.9% | 8.1% |
| Range | 3.3% | 7.9% |
| Mean | 2.4% | 3.2% |
| Median | 2.5% | 2.9% |
| Interquartile 25% (IQ1) | 1.8% | 2.5% |
| Interquartile 75% (IQ3) | 2.9% | 3.7% |
| Interquartile Range (IQR) | 1.0% | 1.2% |
| Standard Deviation (Sample) | 0.71% | 1.4% |
| Standard Deviation (Population) | 0.70% | 1.4% |
Similar Demographics by Hearing Disability
Demographics Similar to Haitians by Hearing Disability
In terms of hearing disability, the demographic groups most similar to Haitians are Immigrants from China (2.6%, a difference of 0.080%), Immigrants from Jamaica (2.6%, a difference of 0.32%), Immigrants from Taiwan (2.6%, a difference of 0.34%), West Indian (2.6%, a difference of 0.34%), and Senegalese (2.6%, a difference of 0.35%).
| Demographics | Rating | Rank | Hearing Disability |
| Filipinos | 99.6 /100 | #33 | Exceptional 2.6% |
| Immigrants | Pakistan | 99.6 /100 | #34 | Exceptional 2.6% |
| Salvadorans | 99.6 /100 | #35 | Exceptional 2.6% |
| Okinawans | 99.6 /100 | #36 | Exceptional 2.6% |
| Immigrants | Western Africa | 99.6 /100 | #37 | Exceptional 2.6% |
| Immigrants | Jamaica | 99.5 /100 | #38 | Exceptional 2.6% |
| Immigrants | China | 99.5 /100 | #39 | Exceptional 2.6% |
| Haitians | 99.5 /100 | #40 | Exceptional 2.6% |
| Immigrants | Taiwan | 99.4 /100 | #41 | Exceptional 2.6% |
| West Indians | 99.4 /100 | #42 | Exceptional 2.6% |
| Senegalese | 99.4 /100 | #43 | Exceptional 2.6% |
| Nigerians | 99.4 /100 | #44 | Exceptional 2.6% |
| Venezuelans | 99.4 /100 | #45 | Exceptional 2.6% |
| Immigrants | Dominica | 99.3 /100 | #46 | Exceptional 2.6% |
| Immigrants | Israel | 99.3 /100 | #47 | Exceptional 2.6% |
Demographics Similar to Immigrants from Belarus by Hearing Disability
In terms of hearing disability, the demographic groups most similar to Immigrants from Belarus are Cambodian (2.8%, a difference of 0.17%), U.S. Virgin Islander (2.8%, a difference of 0.31%), Immigrants from Latin America (2.8%, a difference of 0.34%), Immigrants from Yemen (2.8%, a difference of 0.39%), and Immigrants (2.8%, a difference of 0.41%).
| Demographics | Rating | Rank | Hearing Disability |
| Hondurans | 93.4 /100 | #106 | Exceptional 2.8% |
| Immigrants | Chile | 93.4 /100 | #107 | Exceptional 2.8% |
| Guatemalans | 93.2 /100 | #108 | Exceptional 2.8% |
| Turks | 93.0 /100 | #109 | Exceptional 2.8% |
| Cypriots | 92.9 /100 | #110 | Exceptional 2.8% |
| Immigrants | Yemen | 92.7 /100 | #111 | Exceptional 2.8% |
| U.S. Virgin Islanders | 92.5 /100 | #112 | Exceptional 2.8% |
| Immigrants | Belarus | 91.6 /100 | #113 | Exceptional 2.8% |
| Cambodians | 91.1 /100 | #114 | Exceptional 2.8% |
| Immigrants | Latin America | 90.5 /100 | #115 | Exceptional 2.8% |
| Immigrants | Immigrants | 90.3 /100 | #116 | Exceptional 2.8% |
| Immigrants | Liberia | 90.0 /100 | #117 | Excellent 2.8% |
| Zimbabweans | 89.9 /100 | #118 | Excellent 2.8% |
| Kenyans | 89.8 /100 | #119 | Excellent 2.8% |
| Jordanians | 89.5 /100 | #120 | Excellent 2.8% |