Haitian vs Immigrants from Kuwait Average Family Size
COMPARE
Haitian
Immigrants from Kuwait
Average Family Size
Average Family Size Comparison
Haitians
Immigrants from Kuwait
3.37
AVERAGE FAMILY SIZE
100.0/ 100
METRIC RATING
46th/ 347
METRIC RANK
3.19
AVERAGE FAMILY SIZE
7.2/ 100
METRIC RATING
222nd/ 347
METRIC RANK
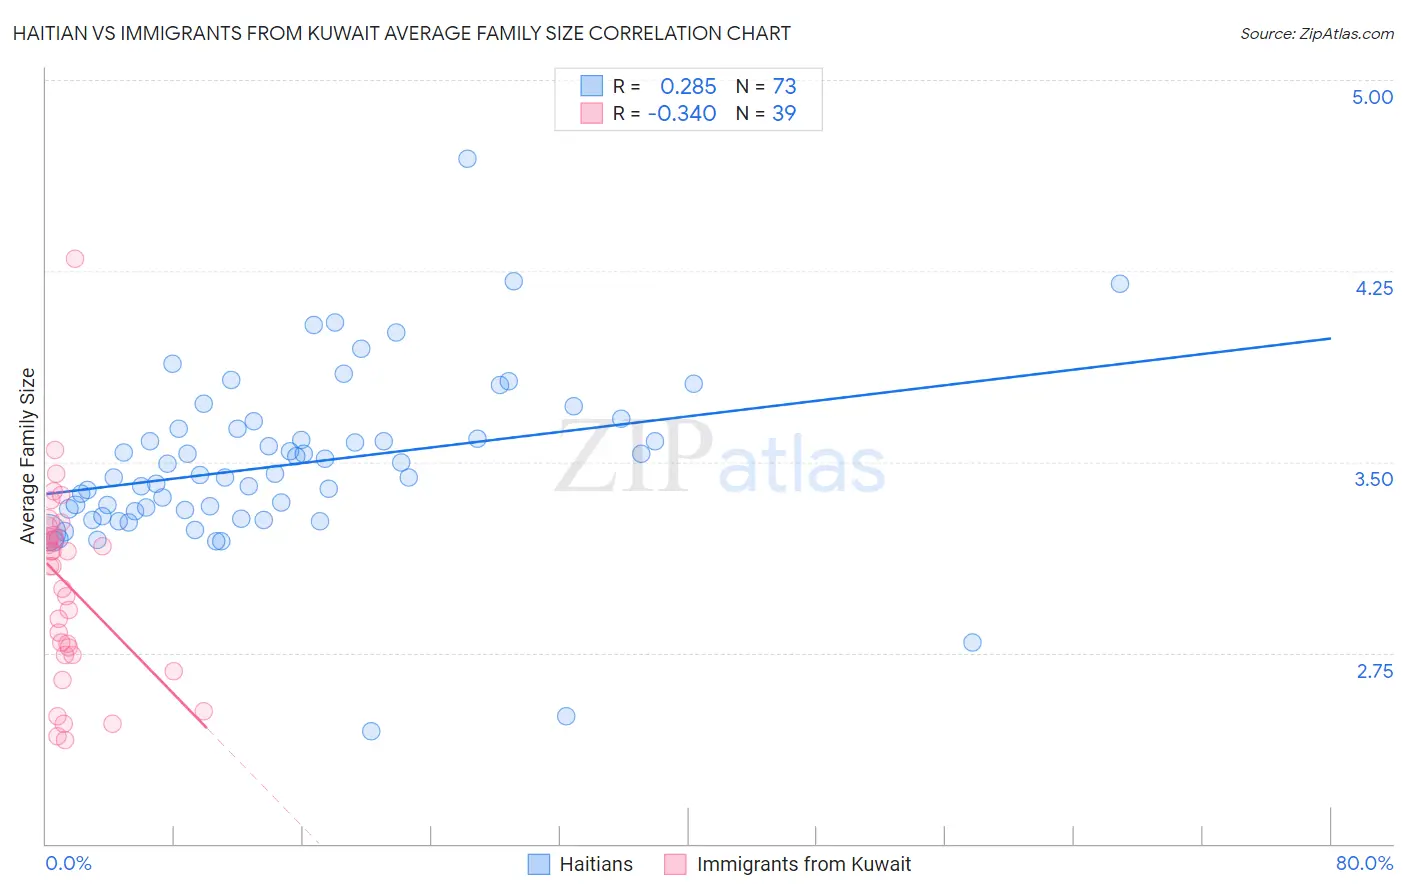
Haitian vs Immigrants from Kuwait Average Family Size Correlation Chart
The statistical analysis conducted on geographies consisting of 287,712,478 people shows a weak positive correlation between the proportion of Haitians and average family size in the United States with a correlation coefficient (R) of 0.285 and weighted average of 3.37. Similarly, the statistical analysis conducted on geographies consisting of 136,887,006 people shows a mild negative correlation between the proportion of Immigrants from Kuwait and average family size in the United States with a correlation coefficient (R) of -0.340 and weighted average of 3.19, a difference of 5.7%.
Average Family Size Correlation Summary
| Measurement | Haitian | Immigrants from Kuwait |
| Minimum | 2.44 | 2.41 |
| Maximum | 4.69 | 4.30 |
| Range | 2.25 | 1.89 |
| Mean | 3.49 | 3.02 |
| Median | 3.45 | 3.09 |
| Interquartile 25% (IQ1) | 3.30 | 2.74 |
| Interquartile 75% (IQ3) | 3.63 | 3.21 |
| Interquartile Range (IQR) | 0.33 | 0.47 |
| Standard Deviation (Sample) | 0.34 | 0.38 |
| Standard Deviation (Population) | 0.34 | 0.37 |
Similar Demographics by Average Family Size
Demographics Similar to Haitians by Average Family Size
In terms of average family size, the demographic groups most similar to Haitians are Vietnamese (3.37, a difference of 0.040%), Immigrants from Nicaragua (3.37, a difference of 0.040%), Shoshone (3.37, a difference of 0.060%), Alaska Native (3.37, a difference of 0.090%), and Immigrants from Philippines (3.37, a difference of 0.10%).
| Demographics | Rating | Rank | Average Family Size |
| Immigrants | Haiti | 100.0 /100 | #39 | Exceptional 3.39 |
| Belizeans | 100.0 /100 | #40 | Exceptional 3.39 |
| Marshallese | 100.0 /100 | #41 | Exceptional 3.38 |
| Immigrants | Vietnam | 100.0 /100 | #42 | Exceptional 3.38 |
| Immigrants | Philippines | 100.0 /100 | #43 | Exceptional 3.37 |
| Alaska Natives | 100.0 /100 | #44 | Exceptional 3.37 |
| Shoshone | 100.0 /100 | #45 | Exceptional 3.37 |
| Haitians | 100.0 /100 | #46 | Exceptional 3.37 |
| Vietnamese | 100.0 /100 | #47 | Exceptional 3.37 |
| Immigrants | Nicaragua | 100.0 /100 | #48 | Exceptional 3.37 |
| Bangladeshis | 100.0 /100 | #49 | Exceptional 3.37 |
| Immigrants | Bangladesh | 100.0 /100 | #50 | Exceptional 3.36 |
| Nicaraguans | 100.0 /100 | #51 | Exceptional 3.36 |
| Fijians | 100.0 /100 | #52 | Exceptional 3.36 |
| Koreans | 100.0 /100 | #53 | Exceptional 3.36 |
Demographics Similar to Immigrants from Kuwait by Average Family Size
In terms of average family size, the demographic groups most similar to Immigrants from Kuwait are Immigrants from Ukraine (3.19, a difference of 0.0%), Immigrants from Zimbabwe (3.19, a difference of 0.010%), Syrian (3.19, a difference of 0.050%), Cree (3.19, a difference of 0.070%), and Chickasaw (3.19, a difference of 0.090%).
| Demographics | Rating | Rank | Average Family Size |
| Delaware | 11.1 /100 | #215 | Poor 3.20 |
| Bermudans | 11.0 /100 | #216 | Poor 3.20 |
| Immigrants | Somalia | 10.3 /100 | #217 | Poor 3.20 |
| French American Indians | 9.8 /100 | #218 | Tragic 3.20 |
| Pennsylvania Germans | 9.3 /100 | #219 | Tragic 3.19 |
| Lebanese | 9.1 /100 | #220 | Tragic 3.19 |
| Immigrants | Ukraine | 7.2 /100 | #221 | Tragic 3.19 |
| Immigrants | Kuwait | 7.2 /100 | #222 | Tragic 3.19 |
| Immigrants | Zimbabwe | 7.1 /100 | #223 | Tragic 3.19 |
| Syrians | 6.5 /100 | #224 | Tragic 3.19 |
| Cree | 6.2 /100 | #225 | Tragic 3.19 |
| Chickasaw | 6.0 /100 | #226 | Tragic 3.19 |
| Portuguese | 6.0 /100 | #227 | Tragic 3.19 |
| Immigrants | Nonimmigrants | 5.7 /100 | #228 | Tragic 3.19 |
| Immigrants | Italy | 5.3 /100 | #229 | Tragic 3.19 |