Haitian vs Asian Average Family Size
COMPARE
Haitian
Asian
Average Family Size
Average Family Size Comparison
Haitians
Asians
3.37
AVERAGE FAMILY SIZE
100.0/ 100
METRIC RATING
46th/ 347
METRIC RANK
3.28
AVERAGE FAMILY SIZE
97.0/ 100
METRIC RATING
108th/ 347
METRIC RANK
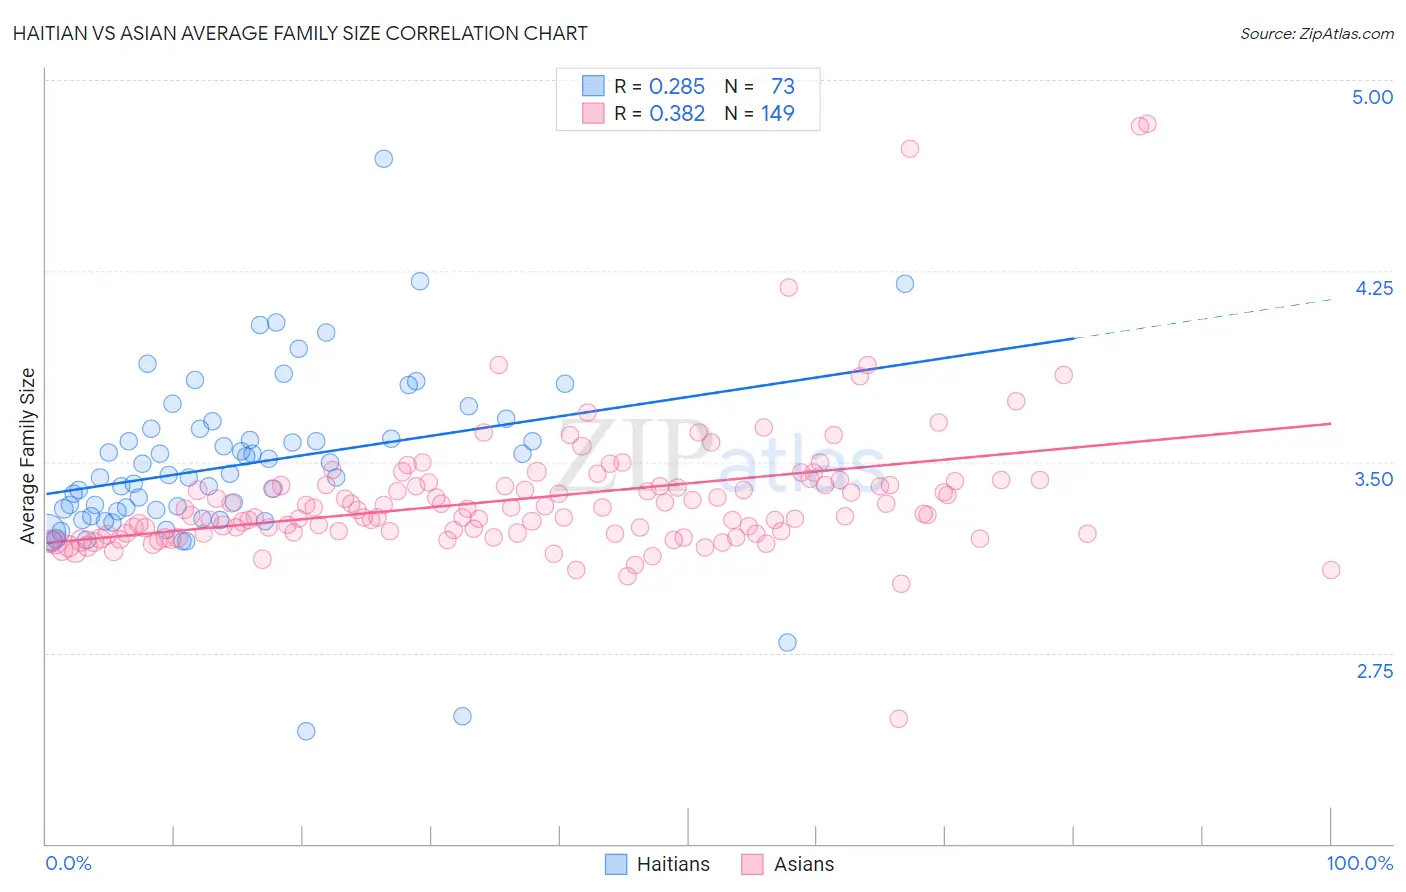
Haitian vs Asian Average Family Size Correlation Chart
The statistical analysis conducted on geographies consisting of 287,712,478 people shows a weak positive correlation between the proportion of Haitians and average family size in the United States with a correlation coefficient (R) of 0.285 and weighted average of 3.37. Similarly, the statistical analysis conducted on geographies consisting of 550,276,213 people shows a mild positive correlation between the proportion of Asians and average family size in the United States with a correlation coefficient (R) of 0.382 and weighted average of 3.28, a difference of 2.8%.
Average Family Size Correlation Summary
| Measurement | Haitian | Asian |
| Minimum | 2.44 | 2.49 |
| Maximum | 4.69 | 4.83 |
| Range | 2.25 | 2.34 |
| Mean | 3.49 | 3.36 |
| Median | 3.45 | 3.29 |
| Interquartile 25% (IQ1) | 3.30 | 3.22 |
| Interquartile 75% (IQ3) | 3.63 | 3.41 |
| Interquartile Range (IQR) | 0.33 | 0.19 |
| Standard Deviation (Sample) | 0.34 | 0.28 |
| Standard Deviation (Population) | 0.34 | 0.28 |
Similar Demographics by Average Family Size
Demographics Similar to Haitians by Average Family Size
In terms of average family size, the demographic groups most similar to Haitians are Vietnamese (3.37, a difference of 0.040%), Immigrants from Nicaragua (3.37, a difference of 0.040%), Shoshone (3.37, a difference of 0.060%), Alaska Native (3.37, a difference of 0.090%), and Immigrants from Philippines (3.37, a difference of 0.10%).
| Demographics | Rating | Rank | Average Family Size |
| Immigrants | Haiti | 100.0 /100 | #39 | Exceptional 3.39 |
| Belizeans | 100.0 /100 | #40 | Exceptional 3.39 |
| Marshallese | 100.0 /100 | #41 | Exceptional 3.38 |
| Immigrants | Vietnam | 100.0 /100 | #42 | Exceptional 3.38 |
| Immigrants | Philippines | 100.0 /100 | #43 | Exceptional 3.37 |
| Alaska Natives | 100.0 /100 | #44 | Exceptional 3.37 |
| Shoshone | 100.0 /100 | #45 | Exceptional 3.37 |
| Haitians | 100.0 /100 | #46 | Exceptional 3.37 |
| Vietnamese | 100.0 /100 | #47 | Exceptional 3.37 |
| Immigrants | Nicaragua | 100.0 /100 | #48 | Exceptional 3.37 |
| Bangladeshis | 100.0 /100 | #49 | Exceptional 3.37 |
| Immigrants | Bangladesh | 100.0 /100 | #50 | Exceptional 3.36 |
| Nicaraguans | 100.0 /100 | #51 | Exceptional 3.36 |
| Fijians | 100.0 /100 | #52 | Exceptional 3.36 |
| Koreans | 100.0 /100 | #53 | Exceptional 3.36 |
Demographics Similar to Asians by Average Family Size
In terms of average family size, the demographic groups most similar to Asians are Puerto Rican (3.28, a difference of 0.050%), Bahamian (3.28, a difference of 0.060%), Indonesian (3.28, a difference of 0.11%), Ghanaian (3.29, a difference of 0.17%), and Black/African American (3.27, a difference of 0.17%).
| Demographics | Rating | Rank | Average Family Size |
| Immigrants | Burma/Myanmar | 98.6 /100 | #101 | Exceptional 3.29 |
| West Indians | 98.5 /100 | #102 | Exceptional 3.29 |
| Immigrants | Western Africa | 98.4 /100 | #103 | Exceptional 3.29 |
| Bolivians | 98.3 /100 | #104 | Exceptional 3.29 |
| Immigrants | Ghana | 98.1 /100 | #105 | Exceptional 3.29 |
| Paiute | 98.0 /100 | #106 | Exceptional 3.29 |
| Ghanaians | 98.0 /100 | #107 | Exceptional 3.29 |
| Asians | 97.0 /100 | #108 | Exceptional 3.28 |
| Puerto Ricans | 96.7 /100 | #109 | Exceptional 3.28 |
| Bahamians | 96.6 /100 | #110 | Exceptional 3.28 |
| Indonesians | 96.2 /100 | #111 | Exceptional 3.28 |
| Blacks/African Americans | 95.7 /100 | #112 | Exceptional 3.27 |
| Immigrants | Panama | 95.6 /100 | #113 | Exceptional 3.27 |
| South Americans | 95.1 /100 | #114 | Exceptional 3.27 |
| Immigrants | Liberia | 95.0 /100 | #115 | Exceptional 3.27 |