Belizean vs Armenian Married-couple Households
COMPARE
Belizean
Armenian
Married-couple Households
Married-couple Households Comparison
Belizeans
Armenians
42.2%
MARRIED-COUPLE HOUSEHOLDS
0.0/ 100
METRIC RATING
286th/ 347
METRIC RANK
46.9%
MARRIED-COUPLE HOUSEHOLDS
75.4/ 100
METRIC RATING
156th/ 347
METRIC RANK
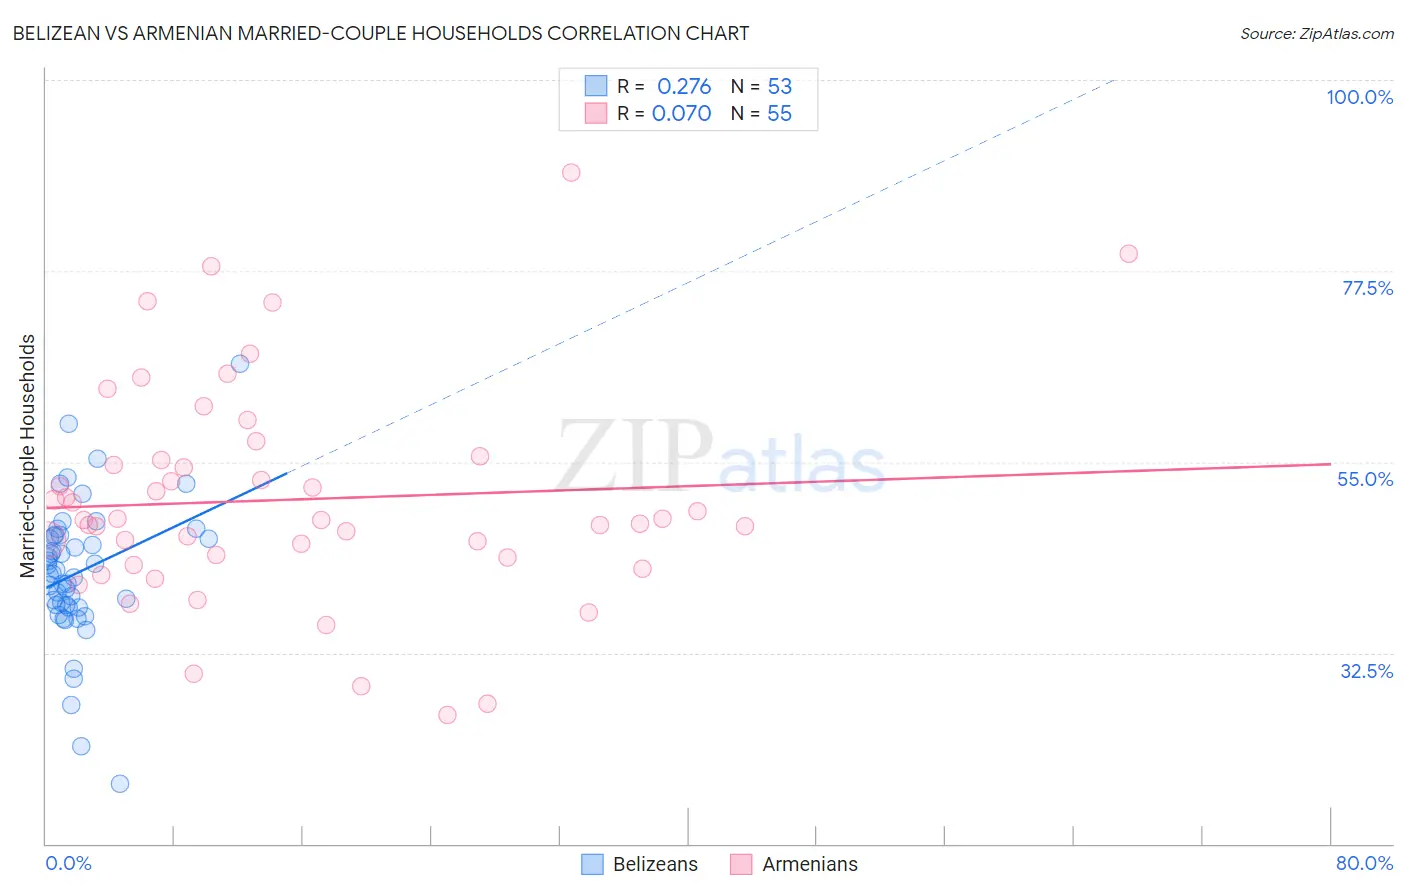
Belizean vs Armenian Married-couple Households Correlation Chart
The statistical analysis conducted on geographies consisting of 144,151,479 people shows a weak positive correlation between the proportion of Belizeans and percentage of married-couple family households in the United States with a correlation coefficient (R) of 0.276 and weighted average of 42.2%. Similarly, the statistical analysis conducted on geographies consisting of 310,765,570 people shows a slight positive correlation between the proportion of Armenians and percentage of married-couple family households in the United States with a correlation coefficient (R) of 0.070 and weighted average of 46.9%, a difference of 11.1%.
Married-couple Households Correlation Summary
| Measurement | Belizean | Armenian |
| Minimum | 17.1% | 25.2% |
| Maximum | 66.5% | 89.1% |
| Range | 49.4% | 63.9% |
| Mean | 42.0% | 50.5% |
| Median | 41.9% | 48.2% |
| Interquartile 25% (IQ1) | 38.0% | 43.8% |
| Interquartile 75% (IQ3) | 46.3% | 55.2% |
| Interquartile Range (IQR) | 8.3% | 11.4% |
| Standard Deviation (Sample) | 8.4% | 12.8% |
| Standard Deviation (Population) | 8.3% | 12.7% |
Similar Demographics by Married-couple Households
Demographics Similar to Belizeans by Married-couple Households
In terms of married-couple households, the demographic groups most similar to Belizeans are Ghanaian (42.2%, a difference of 0.010%), Cheyenne (42.3%, a difference of 0.040%), Chippewa (42.1%, a difference of 0.24%), Immigrants from Eritrea (42.1%, a difference of 0.32%), and Sudanese (42.1%, a difference of 0.37%).
| Demographics | Rating | Rank | Married-couple Households |
| Sierra Leoneans | 0.0 /100 | #279 | Tragic 42.9% |
| Immigrants | Ecuador | 0.0 /100 | #280 | Tragic 42.9% |
| Immigrants | Guatemala | 0.0 /100 | #281 | Tragic 42.8% |
| Bermudans | 0.0 /100 | #282 | Tragic 42.4% |
| Inupiat | 0.0 /100 | #283 | Tragic 42.4% |
| Cheyenne | 0.0 /100 | #284 | Tragic 42.3% |
| Ghanaians | 0.0 /100 | #285 | Tragic 42.2% |
| Belizeans | 0.0 /100 | #286 | Tragic 42.2% |
| Chippewa | 0.0 /100 | #287 | Tragic 42.1% |
| Immigrants | Eritrea | 0.0 /100 | #288 | Tragic 42.1% |
| Sudanese | 0.0 /100 | #289 | Tragic 42.1% |
| Hondurans | 0.0 /100 | #290 | Tragic 42.1% |
| Paiute | 0.0 /100 | #291 | Tragic 42.1% |
| Indonesians | 0.0 /100 | #292 | Tragic 42.0% |
| Menominee | 0.0 /100 | #293 | Tragic 42.0% |
Demographics Similar to Armenians by Married-couple Households
In terms of married-couple households, the demographic groups most similar to Armenians are Arab (46.9%, a difference of 0.030%), Immigrants from Oceania (46.9%, a difference of 0.030%), Hmong (47.0%, a difference of 0.040%), Immigrants from Western Asia (46.9%, a difference of 0.040%), and Serbian (47.0%, a difference of 0.050%).
| Demographics | Rating | Rank | Married-couple Households |
| Paraguayans | 78.7 /100 | #149 | Good 47.0% |
| Immigrants | Russia | 77.6 /100 | #150 | Good 47.0% |
| Immigrants | Bulgaria | 76.8 /100 | #151 | Good 47.0% |
| Serbians | 76.3 /100 | #152 | Good 47.0% |
| Hmong | 76.2 /100 | #153 | Good 47.0% |
| Immigrants | Western Asia | 76.1 /100 | #154 | Good 46.9% |
| Arabs | 76.0 /100 | #155 | Good 46.9% |
| Armenians | 75.4 /100 | #156 | Good 46.9% |
| Immigrants | Oceania | 74.8 /100 | #157 | Good 46.9% |
| Immigrants | Nonimmigrants | 73.3 /100 | #158 | Good 46.9% |
| Osage | 73.2 /100 | #159 | Good 46.9% |
| Iraqis | 71.7 /100 | #160 | Good 46.9% |
| Delaware | 71.2 /100 | #161 | Good 46.8% |
| Colombians | 71.0 /100 | #162 | Good 46.8% |
| Immigrants | Turkey | 70.2 /100 | #163 | Good 46.8% |