Norwegian vs Apache Currently Married
COMPARE
Norwegian
Apache
Currently Married
Currently Married Comparison
Norwegians
Apache
50.2%
CURRENTLY MARRIED
100.0/ 100
METRIC RATING
6th/ 347
METRIC RANK
43.2%
CURRENTLY MARRIED
0.0/ 100
METRIC RATING
280th/ 347
METRIC RANK
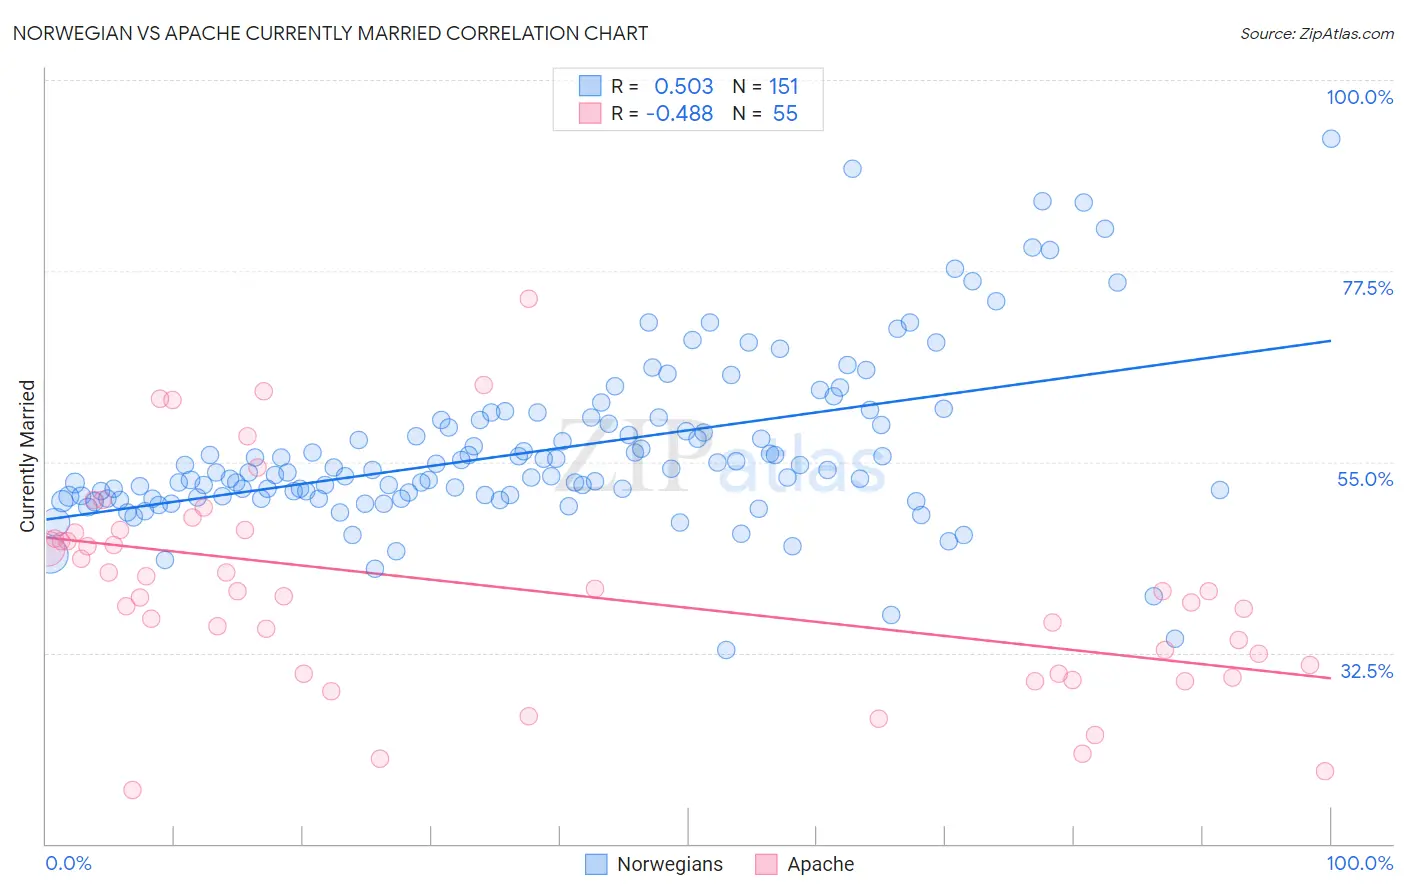
Norwegian vs Apache Currently Married Correlation Chart
The statistical analysis conducted on geographies consisting of 533,299,404 people shows a substantial positive correlation between the proportion of Norwegians and percentage of population currently married in the United States with a correlation coefficient (R) of 0.503 and weighted average of 50.2%. Similarly, the statistical analysis conducted on geographies consisting of 231,125,444 people shows a moderate negative correlation between the proportion of Apache and percentage of population currently married in the United States with a correlation coefficient (R) of -0.488 and weighted average of 43.2%, a difference of 16.1%.
Currently Married Correlation Summary
| Measurement | Norwegian | Apache |
| Minimum | 32.9% | 16.3% |
| Maximum | 93.0% | 74.2% |
| Range | 60.2% | 57.9% |
| Mean | 56.4% | 40.0% |
| Median | 53.7% | 39.7% |
| Interquartile 25% (IQ1) | 50.8% | 30.0% |
| Interquartile 75% (IQ3) | 59.9% | 46.7% |
| Interquartile Range (IQR) | 9.1% | 16.7% |
| Standard Deviation (Sample) | 9.9% | 12.3% |
| Standard Deviation (Population) | 9.8% | 12.2% |
Similar Demographics by Currently Married
Demographics Similar to Norwegians by Currently Married
In terms of currently married, the demographic groups most similar to Norwegians are Immigrants from South Central Asia (50.0%, a difference of 0.34%), Swedish (50.0%, a difference of 0.47%), Danish (50.5%, a difference of 0.54%), Czech (49.9%, a difference of 0.66%), and Filipino (49.7%, a difference of 0.92%).
| Demographics | Rating | Rank | Currently Married |
| Immigrants | India | 100.0 /100 | #1 | Exceptional 51.8% |
| Thais | 100.0 /100 | #2 | Exceptional 50.9% |
| Assyrians/Chaldeans/Syriacs | 100.0 /100 | #3 | Exceptional 50.8% |
| Immigrants | Taiwan | 100.0 /100 | #4 | Exceptional 50.7% |
| Danes | 100.0 /100 | #5 | Exceptional 50.5% |
| Norwegians | 100.0 /100 | #6 | Exceptional 50.2% |
| Immigrants | South Central Asia | 100.0 /100 | #7 | Exceptional 50.0% |
| Swedes | 100.0 /100 | #8 | Exceptional 50.0% |
| Czechs | 99.9 /100 | #9 | Exceptional 49.9% |
| Filipinos | 99.9 /100 | #10 | Exceptional 49.7% |
| English | 99.9 /100 | #11 | Exceptional 49.7% |
| Swiss | 99.9 /100 | #12 | Exceptional 49.7% |
| Dutch | 99.9 /100 | #13 | Exceptional 49.6% |
| Germans | 99.9 /100 | #14 | Exceptional 49.6% |
| Pennsylvania Germans | 99.9 /100 | #15 | Exceptional 49.6% |
Demographics Similar to Apache by Currently Married
In terms of currently married, the demographic groups most similar to Apache are Chippewa (43.2%, a difference of 0.010%), Central American Indian (43.3%, a difference of 0.080%), Immigrants from Ecuador (43.2%, a difference of 0.080%), Kiowa (43.2%, a difference of 0.19%), and Immigrants from El Salvador (43.1%, a difference of 0.20%).
| Demographics | Rating | Rank | Currently Married |
| Yaqui | 0.1 /100 | #273 | Tragic 43.4% |
| Nigerians | 0.1 /100 | #274 | Tragic 43.4% |
| Colville | 0.1 /100 | #275 | Tragic 43.4% |
| Sierra Leoneans | 0.1 /100 | #276 | Tragic 43.4% |
| Immigrants | Nigeria | 0.1 /100 | #277 | Tragic 43.4% |
| Central Americans | 0.0 /100 | #278 | Tragic 43.3% |
| Central American Indians | 0.0 /100 | #279 | Tragic 43.3% |
| Apache | 0.0 /100 | #280 | Tragic 43.2% |
| Chippewa | 0.0 /100 | #281 | Tragic 43.2% |
| Immigrants | Ecuador | 0.0 /100 | #282 | Tragic 43.2% |
| Kiowa | 0.0 /100 | #283 | Tragic 43.2% |
| Immigrants | El Salvador | 0.0 /100 | #284 | Tragic 43.1% |
| Immigrants | Middle Africa | 0.0 /100 | #285 | Tragic 43.0% |
| Ghanaians | 0.0 /100 | #286 | Tragic 42.9% |
| Guatemalans | 0.0 /100 | #287 | Tragic 42.9% |