Guyanese vs Cambodian Currently Married
COMPARE
Guyanese
Cambodian
Currently Married
Currently Married Comparison
Guyanese
Cambodians
41.6%
CURRENTLY MARRIED
0.0/ 100
METRIC RATING
310th/ 347
METRIC RANK
47.0%
CURRENTLY MARRIED
70.4/ 100
METRIC RATING
148th/ 347
METRIC RANK
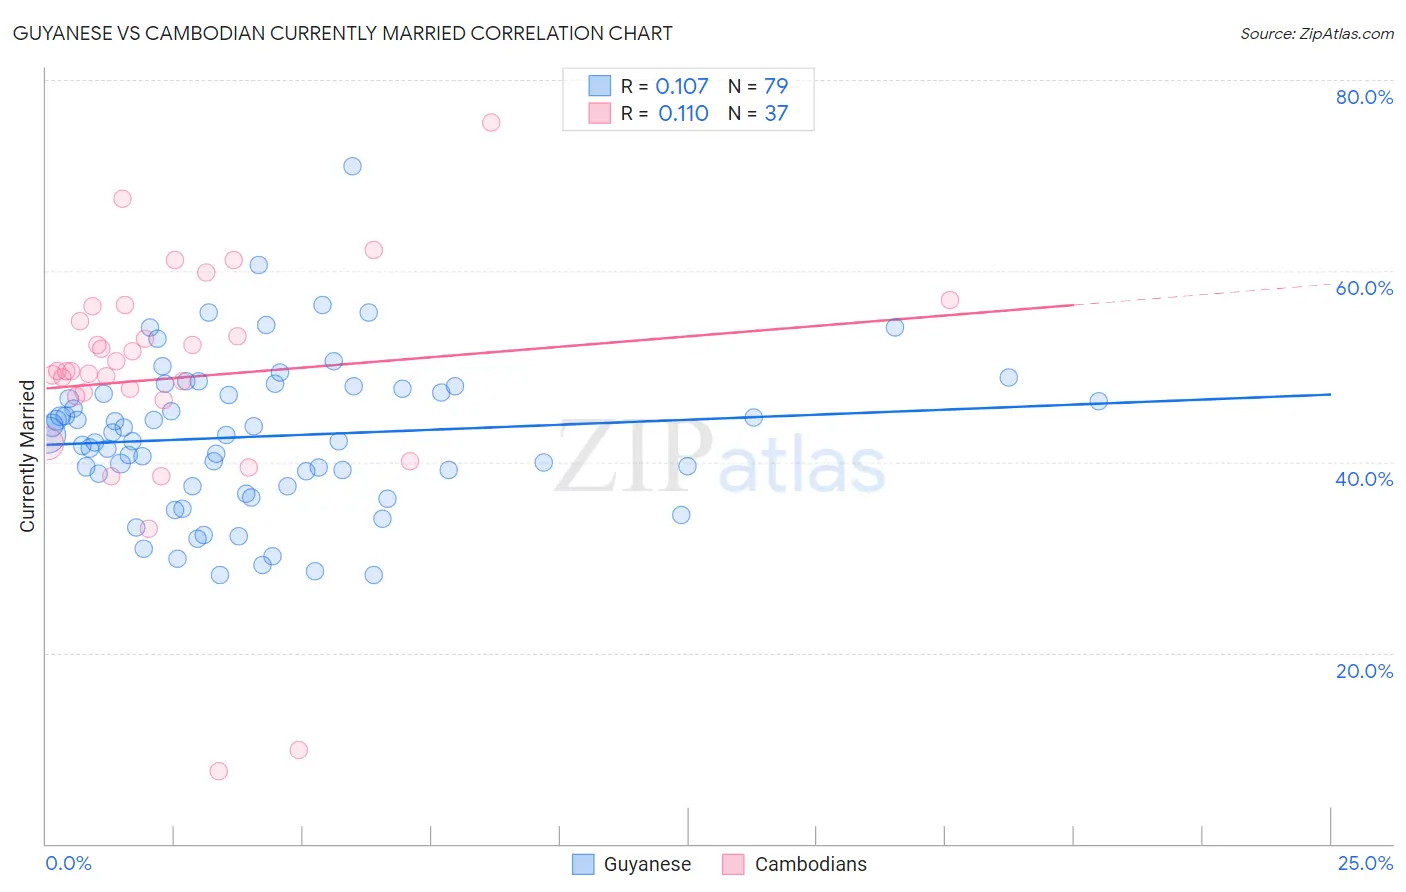
Guyanese vs Cambodian Currently Married Correlation Chart
The statistical analysis conducted on geographies consisting of 176,911,764 people shows a poor positive correlation between the proportion of Guyanese and percentage of population currently married in the United States with a correlation coefficient (R) of 0.107 and weighted average of 41.6%. Similarly, the statistical analysis conducted on geographies consisting of 102,515,172 people shows a poor positive correlation between the proportion of Cambodians and percentage of population currently married in the United States with a correlation coefficient (R) of 0.110 and weighted average of 47.0%, a difference of 13.0%.
Currently Married Correlation Summary
| Measurement | Guyanese | Cambodian |
| Minimum | 28.1% | 7.6% |
| Maximum | 71.0% | 75.6% |
| Range | 42.9% | 68.0% |
| Mean | 42.7% | 48.8% |
| Median | 42.8% | 49.5% |
| Interquartile 25% (IQ1) | 37.5% | 46.7% |
| Interquartile 75% (IQ3) | 47.7% | 55.5% |
| Interquartile Range (IQR) | 10.2% | 8.8% |
| Standard Deviation (Sample) | 7.9% | 12.8% |
| Standard Deviation (Population) | 7.9% | 12.6% |
Similar Demographics by Currently Married
Demographics Similar to Guyanese by Currently Married
In terms of currently married, the demographic groups most similar to Guyanese are Trinidadian and Tobagonian (41.5%, a difference of 0.15%), Somali (41.5%, a difference of 0.33%), Immigrants from Liberia (41.8%, a difference of 0.36%), Immigrants from Belize (41.8%, a difference of 0.48%), and African (41.8%, a difference of 0.52%).
| Demographics | Rating | Rank | Currently Married |
| Sioux | 0.0 /100 | #303 | Tragic 41.9% |
| Immigrants | Bahamas | 0.0 /100 | #304 | Tragic 41.9% |
| Immigrants | Trinidad and Tobago | 0.0 /100 | #305 | Tragic 41.9% |
| Immigrants | Guyana | 0.0 /100 | #306 | Tragic 41.9% |
| Africans | 0.0 /100 | #307 | Tragic 41.8% |
| Immigrants | Belize | 0.0 /100 | #308 | Tragic 41.8% |
| Immigrants | Liberia | 0.0 /100 | #309 | Tragic 41.8% |
| Guyanese | 0.0 /100 | #310 | Tragic 41.6% |
| Trinidadians and Tobagonians | 0.0 /100 | #311 | Tragic 41.5% |
| Somalis | 0.0 /100 | #312 | Tragic 41.5% |
| Jamaicans | 0.0 /100 | #313 | Tragic 41.4% |
| West Indians | 0.0 /100 | #314 | Tragic 41.3% |
| Inupiat | 0.0 /100 | #315 | Tragic 41.3% |
| Immigrants | Caribbean | 0.0 /100 | #316 | Tragic 41.3% |
| Haitians | 0.0 /100 | #317 | Tragic 41.3% |
Demographics Similar to Cambodians by Currently Married
In terms of currently married, the demographic groups most similar to Cambodians are Zimbabwean (47.0%, a difference of 0.010%), Immigrants from Turkey (47.0%, a difference of 0.010%), Chilean (47.0%, a difference of 0.030%), Immigrants from Argentina (47.0%, a difference of 0.070%), and Immigrants from Serbia (47.0%, a difference of 0.070%).
| Demographics | Rating | Rank | Currently Married |
| Venezuelans | 74.4 /100 | #141 | Good 47.1% |
| Argentineans | 74.4 /100 | #142 | Good 47.1% |
| Guamanians/Chamorros | 74.2 /100 | #143 | Good 47.1% |
| Hmong | 73.4 /100 | #144 | Good 47.1% |
| Immigrants | South Eastern Asia | 72.9 /100 | #145 | Good 47.1% |
| Carpatho Rusyns | 72.6 /100 | #146 | Good 47.0% |
| Immigrants | Argentina | 72.0 /100 | #147 | Good 47.0% |
| Cambodians | 70.4 /100 | #148 | Good 47.0% |
| Zimbabweans | 70.1 /100 | #149 | Good 47.0% |
| Immigrants | Turkey | 70.0 /100 | #150 | Good 47.0% |
| Chileans | 69.8 /100 | #151 | Good 47.0% |
| Immigrants | Serbia | 68.8 /100 | #152 | Good 47.0% |
| Immigrants | Venezuela | 68.6 /100 | #153 | Good 47.0% |
| Albanians | 68.6 /100 | #154 | Good 47.0% |
| Arabs | 68.6 /100 | #155 | Good 47.0% |