Guyanese vs Immigrants from Belgium Currently Married
COMPARE
Guyanese
Immigrants from Belgium
Currently Married
Currently Married Comparison
Guyanese
Immigrants from Belgium
41.6%
CURRENTLY MARRIED
0.0/ 100
METRIC RATING
310th/ 347
METRIC RANK
48.1%
CURRENTLY MARRIED
97.1/ 100
METRIC RATING
78th/ 347
METRIC RANK
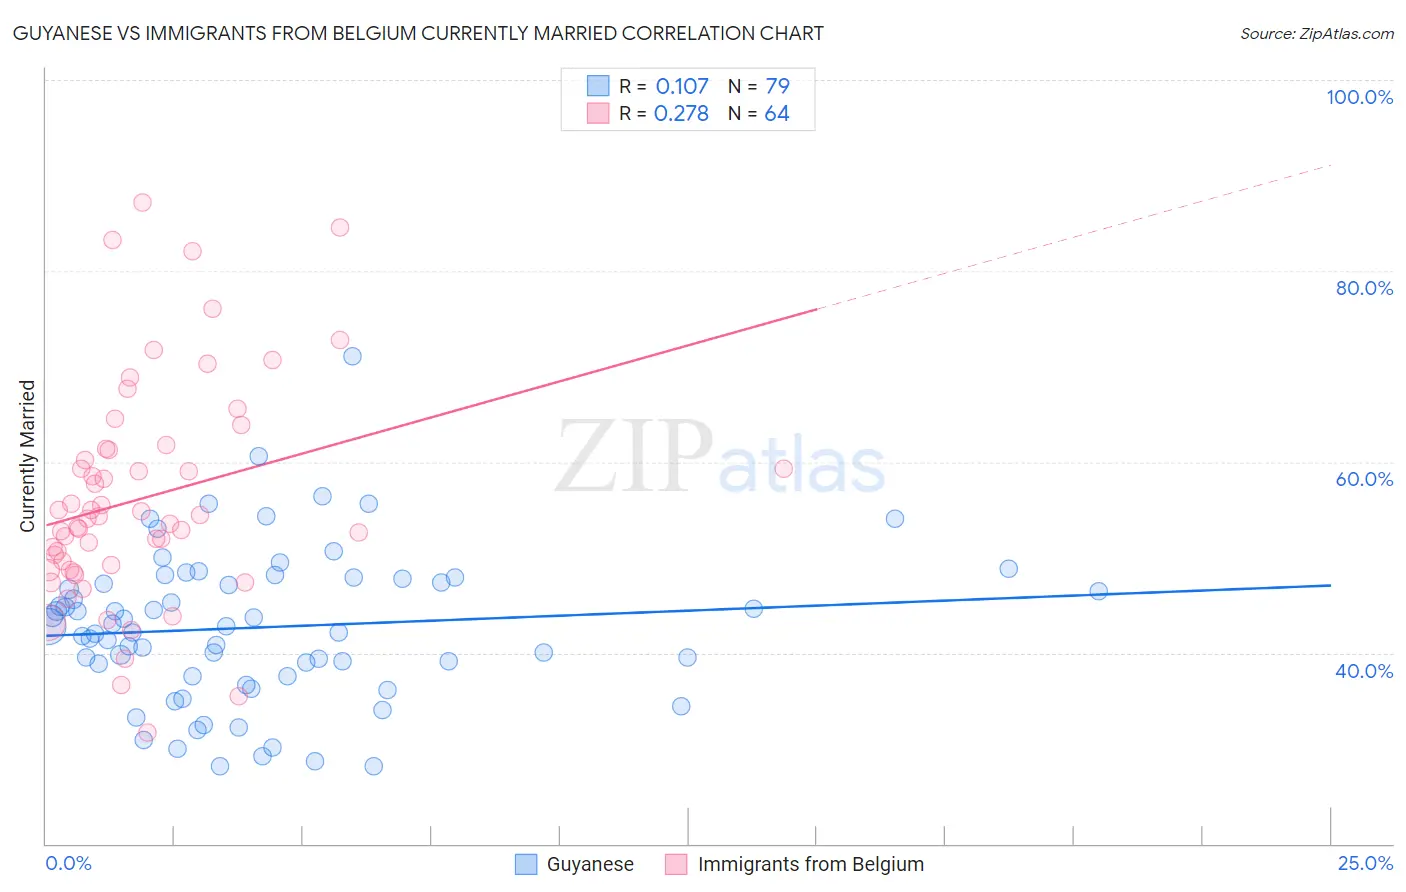
Guyanese vs Immigrants from Belgium Currently Married Correlation Chart
The statistical analysis conducted on geographies consisting of 176,911,764 people shows a poor positive correlation between the proportion of Guyanese and percentage of population currently married in the United States with a correlation coefficient (R) of 0.107 and weighted average of 41.6%. Similarly, the statistical analysis conducted on geographies consisting of 146,720,291 people shows a weak positive correlation between the proportion of Immigrants from Belgium and percentage of population currently married in the United States with a correlation coefficient (R) of 0.278 and weighted average of 48.1%, a difference of 15.7%.
Currently Married Correlation Summary
| Measurement | Guyanese | Immigrants from Belgium |
| Minimum | 28.1% | 31.6% |
| Maximum | 71.0% | 87.2% |
| Range | 42.9% | 55.6% |
| Mean | 42.7% | 56.2% |
| Median | 42.8% | 54.1% |
| Interquartile 25% (IQ1) | 37.5% | 49.0% |
| Interquartile 75% (IQ3) | 47.7% | 61.3% |
| Interquartile Range (IQR) | 10.2% | 12.4% |
| Standard Deviation (Sample) | 7.9% | 11.6% |
| Standard Deviation (Population) | 7.9% | 11.5% |
Similar Demographics by Currently Married
Demographics Similar to Guyanese by Currently Married
In terms of currently married, the demographic groups most similar to Guyanese are Trinidadian and Tobagonian (41.5%, a difference of 0.15%), Somali (41.5%, a difference of 0.33%), Immigrants from Liberia (41.8%, a difference of 0.36%), Immigrants from Belize (41.8%, a difference of 0.48%), and African (41.8%, a difference of 0.52%).
| Demographics | Rating | Rank | Currently Married |
| Sioux | 0.0 /100 | #303 | Tragic 41.9% |
| Immigrants | Bahamas | 0.0 /100 | #304 | Tragic 41.9% |
| Immigrants | Trinidad and Tobago | 0.0 /100 | #305 | Tragic 41.9% |
| Immigrants | Guyana | 0.0 /100 | #306 | Tragic 41.9% |
| Africans | 0.0 /100 | #307 | Tragic 41.8% |
| Immigrants | Belize | 0.0 /100 | #308 | Tragic 41.8% |
| Immigrants | Liberia | 0.0 /100 | #309 | Tragic 41.8% |
| Guyanese | 0.0 /100 | #310 | Tragic 41.6% |
| Trinidadians and Tobagonians | 0.0 /100 | #311 | Tragic 41.5% |
| Somalis | 0.0 /100 | #312 | Tragic 41.5% |
| Jamaicans | 0.0 /100 | #313 | Tragic 41.4% |
| West Indians | 0.0 /100 | #314 | Tragic 41.3% |
| Inupiat | 0.0 /100 | #315 | Tragic 41.3% |
| Immigrants | Caribbean | 0.0 /100 | #316 | Tragic 41.3% |
| Haitians | 0.0 /100 | #317 | Tragic 41.3% |
Demographics Similar to Immigrants from Belgium by Currently Married
In terms of currently married, the demographic groups most similar to Immigrants from Belgium are Slovene (48.1%, a difference of 0.010%), Immigrants from South Africa (48.1%, a difference of 0.010%), Basque (48.1%, a difference of 0.030%), Immigrants from Poland (48.1%, a difference of 0.040%), and Immigrants from Belarus (48.1%, a difference of 0.050%).
| Demographics | Rating | Rank | Currently Married |
| Macedonians | 97.9 /100 | #71 | Exceptional 48.3% |
| Immigrants | Lebanon | 97.6 /100 | #72 | Exceptional 48.2% |
| Immigrants | Eastern Asia | 97.5 /100 | #73 | Exceptional 48.2% |
| Estonians | 97.4 /100 | #74 | Exceptional 48.2% |
| Immigrants | Belarus | 97.2 /100 | #75 | Exceptional 48.1% |
| Basques | 97.2 /100 | #76 | Exceptional 48.1% |
| Slovenes | 97.1 /100 | #77 | Exceptional 48.1% |
| Immigrants | Belgium | 97.1 /100 | #78 | Exceptional 48.1% |
| Immigrants | South Africa | 97.0 /100 | #79 | Exceptional 48.1% |
| Immigrants | Poland | 96.9 /100 | #80 | Exceptional 48.1% |
| Immigrants | Sri Lanka | 96.9 /100 | #81 | Exceptional 48.1% |
| Immigrants | Europe | 96.9 /100 | #82 | Exceptional 48.1% |
| Bolivians | 96.9 /100 | #83 | Exceptional 48.1% |
| Immigrants | Israel | 96.9 /100 | #84 | Exceptional 48.1% |
| French Canadians | 96.3 /100 | #85 | Exceptional 48.0% |