Guyanese vs Immigrants from Vietnam Currently Married
COMPARE
Guyanese
Immigrants from Vietnam
Currently Married
Currently Married Comparison
Guyanese
Immigrants from Vietnam
41.6%
CURRENTLY MARRIED
0.0/ 100
METRIC RATING
310th/ 347
METRIC RANK
47.2%
CURRENTLY MARRIED
78.2/ 100
METRIC RATING
136th/ 347
METRIC RANK
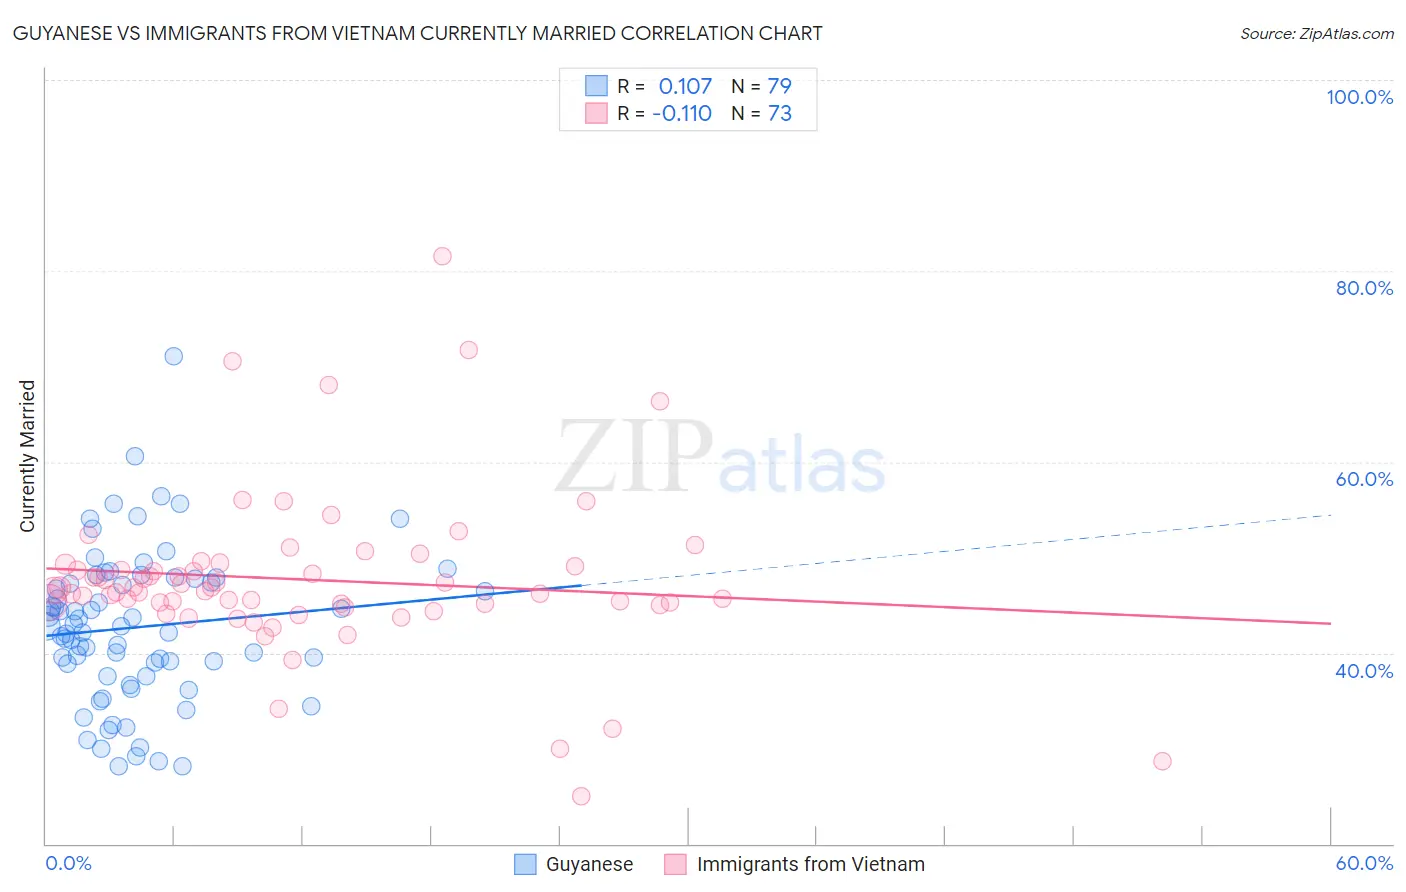
Guyanese vs Immigrants from Vietnam Currently Married Correlation Chart
The statistical analysis conducted on geographies consisting of 176,911,764 people shows a poor positive correlation between the proportion of Guyanese and percentage of population currently married in the United States with a correlation coefficient (R) of 0.107 and weighted average of 41.6%. Similarly, the statistical analysis conducted on geographies consisting of 404,782,059 people shows a poor negative correlation between the proportion of Immigrants from Vietnam and percentage of population currently married in the United States with a correlation coefficient (R) of -0.110 and weighted average of 47.2%, a difference of 13.4%.
Currently Married Correlation Summary
| Measurement | Guyanese | Immigrants from Vietnam |
| Minimum | 28.1% | 25.0% |
| Maximum | 71.0% | 81.5% |
| Range | 42.9% | 56.5% |
| Mean | 42.7% | 47.7% |
| Median | 42.8% | 46.5% |
| Interquartile 25% (IQ1) | 37.5% | 45.0% |
| Interquartile 75% (IQ3) | 47.7% | 49.2% |
| Interquartile Range (IQR) | 10.2% | 4.1% |
| Standard Deviation (Sample) | 7.9% | 8.6% |
| Standard Deviation (Population) | 7.9% | 8.5% |
Similar Demographics by Currently Married
Demographics Similar to Guyanese by Currently Married
In terms of currently married, the demographic groups most similar to Guyanese are Trinidadian and Tobagonian (41.5%, a difference of 0.15%), Somali (41.5%, a difference of 0.33%), Immigrants from Liberia (41.8%, a difference of 0.36%), Immigrants from Belize (41.8%, a difference of 0.48%), and African (41.8%, a difference of 0.52%).
| Demographics | Rating | Rank | Currently Married |
| Sioux | 0.0 /100 | #303 | Tragic 41.9% |
| Immigrants | Bahamas | 0.0 /100 | #304 | Tragic 41.9% |
| Immigrants | Trinidad and Tobago | 0.0 /100 | #305 | Tragic 41.9% |
| Immigrants | Guyana | 0.0 /100 | #306 | Tragic 41.9% |
| Africans | 0.0 /100 | #307 | Tragic 41.8% |
| Immigrants | Belize | 0.0 /100 | #308 | Tragic 41.8% |
| Immigrants | Liberia | 0.0 /100 | #309 | Tragic 41.8% |
| Guyanese | 0.0 /100 | #310 | Tragic 41.6% |
| Trinidadians and Tobagonians | 0.0 /100 | #311 | Tragic 41.5% |
| Somalis | 0.0 /100 | #312 | Tragic 41.5% |
| Jamaicans | 0.0 /100 | #313 | Tragic 41.4% |
| West Indians | 0.0 /100 | #314 | Tragic 41.3% |
| Inupiat | 0.0 /100 | #315 | Tragic 41.3% |
| Immigrants | Caribbean | 0.0 /100 | #316 | Tragic 41.3% |
| Haitians | 0.0 /100 | #317 | Tragic 41.3% |
Demographics Similar to Immigrants from Vietnam by Currently Married
In terms of currently married, the demographic groups most similar to Immigrants from Vietnam are Paraguayan (47.2%, a difference of 0.020%), Pakistani (47.2%, a difference of 0.040%), Yugoslavian (47.2%, a difference of 0.040%), Immigrants from Norway (47.2%, a difference of 0.080%), and Cajun (47.1%, a difference of 0.15%).
| Demographics | Rating | Rank | Currently Married |
| Sri Lankans | 83.2 /100 | #129 | Excellent 47.3% |
| Immigrants | Iraq | 82.8 /100 | #130 | Excellent 47.3% |
| Icelanders | 82.4 /100 | #131 | Excellent 47.3% |
| Afghans | 81.8 /100 | #132 | Excellent 47.3% |
| Immigrants | Malaysia | 81.1 /100 | #133 | Excellent 47.3% |
| Immigrants | Australia | 81.1 /100 | #134 | Excellent 47.3% |
| Immigrants | Norway | 79.7 /100 | #135 | Good 47.2% |
| Immigrants | Vietnam | 78.2 /100 | #136 | Good 47.2% |
| Paraguayans | 77.8 /100 | #137 | Good 47.2% |
| Pakistanis | 77.5 /100 | #138 | Good 47.2% |
| Yugoslavians | 77.4 /100 | #139 | Good 47.2% |
| Cajuns | 75.3 /100 | #140 | Good 47.1% |
| Venezuelans | 74.4 /100 | #141 | Good 47.1% |
| Argentineans | 74.4 /100 | #142 | Good 47.1% |
| Guamanians/Chamorros | 74.2 /100 | #143 | Good 47.1% |