Guyanese vs Immigrants from Denmark Currently Married
COMPARE
Guyanese
Immigrants from Denmark
Currently Married
Currently Married Comparison
Guyanese
Immigrants from Denmark
41.6%
CURRENTLY MARRIED
0.0/ 100
METRIC RATING
310th/ 347
METRIC RANK
47.6%
CURRENTLY MARRIED
90.9/ 100
METRIC RATING
113th/ 347
METRIC RANK
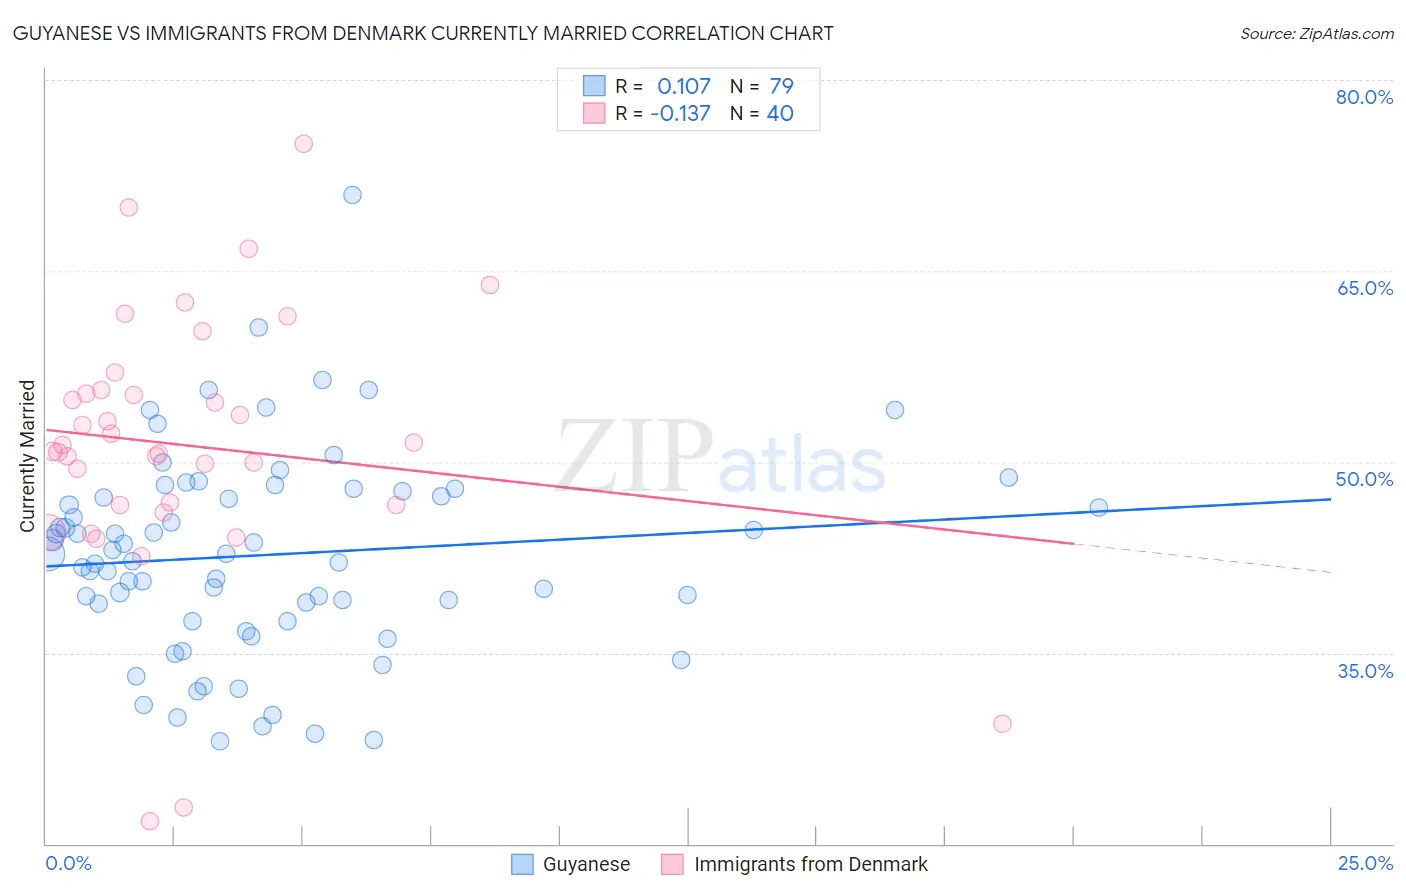
Guyanese vs Immigrants from Denmark Currently Married Correlation Chart
The statistical analysis conducted on geographies consisting of 176,911,764 people shows a poor positive correlation between the proportion of Guyanese and percentage of population currently married in the United States with a correlation coefficient (R) of 0.107 and weighted average of 41.6%. Similarly, the statistical analysis conducted on geographies consisting of 136,433,385 people shows a poor negative correlation between the proportion of Immigrants from Denmark and percentage of population currently married in the United States with a correlation coefficient (R) of -0.137 and weighted average of 47.6%, a difference of 14.4%.
Currently Married Correlation Summary
| Measurement | Guyanese | Immigrants from Denmark |
| Minimum | 28.1% | 21.8% |
| Maximum | 71.0% | 75.0% |
| Range | 42.9% | 53.2% |
| Mean | 42.7% | 51.3% |
| Median | 42.8% | 51.1% |
| Interquartile 25% (IQ1) | 37.5% | 46.6% |
| Interquartile 75% (IQ3) | 47.7% | 55.5% |
| Interquartile Range (IQR) | 10.2% | 8.9% |
| Standard Deviation (Sample) | 7.9% | 10.6% |
| Standard Deviation (Population) | 7.9% | 10.5% |
Similar Demographics by Currently Married
Demographics Similar to Guyanese by Currently Married
In terms of currently married, the demographic groups most similar to Guyanese are Trinidadian and Tobagonian (41.5%, a difference of 0.15%), Somali (41.5%, a difference of 0.33%), Immigrants from Liberia (41.8%, a difference of 0.36%), Immigrants from Belize (41.8%, a difference of 0.48%), and African (41.8%, a difference of 0.52%).
| Demographics | Rating | Rank | Currently Married |
| Sioux | 0.0 /100 | #303 | Tragic 41.9% |
| Immigrants | Bahamas | 0.0 /100 | #304 | Tragic 41.9% |
| Immigrants | Trinidad and Tobago | 0.0 /100 | #305 | Tragic 41.9% |
| Immigrants | Guyana | 0.0 /100 | #306 | Tragic 41.9% |
| Africans | 0.0 /100 | #307 | Tragic 41.8% |
| Immigrants | Belize | 0.0 /100 | #308 | Tragic 41.8% |
| Immigrants | Liberia | 0.0 /100 | #309 | Tragic 41.8% |
| Guyanese | 0.0 /100 | #310 | Tragic 41.6% |
| Trinidadians and Tobagonians | 0.0 /100 | #311 | Tragic 41.5% |
| Somalis | 0.0 /100 | #312 | Tragic 41.5% |
| Jamaicans | 0.0 /100 | #313 | Tragic 41.4% |
| West Indians | 0.0 /100 | #314 | Tragic 41.3% |
| Inupiat | 0.0 /100 | #315 | Tragic 41.3% |
| Immigrants | Caribbean | 0.0 /100 | #316 | Tragic 41.3% |
| Haitians | 0.0 /100 | #317 | Tragic 41.3% |
Demographics Similar to Immigrants from Denmark by Currently Married
In terms of currently married, the demographic groups most similar to Immigrants from Denmark are Immigrants from Western Europe (47.6%, a difference of 0.030%), South African (47.6%, a difference of 0.030%), Immigrants from Hungary (47.6%, a difference of 0.040%), Immigrants from Indonesia (47.6%, a difference of 0.040%), and Palestinian (47.6%, a difference of 0.050%).
| Demographics | Rating | Rank | Currently Married |
| Immigrants | Greece | 93.1 /100 | #106 | Exceptional 47.7% |
| Immigrants | Italy | 92.9 /100 | #107 | Exceptional 47.7% |
| Tsimshian | 92.4 /100 | #108 | Exceptional 47.7% |
| Immigrants | Egypt | 92.3 /100 | #109 | Exceptional 47.7% |
| Immigrants | Russia | 92.0 /100 | #110 | Exceptional 47.7% |
| Immigrants | Hungary | 91.2 /100 | #111 | Exceptional 47.6% |
| Immigrants | Western Europe | 91.1 /100 | #112 | Exceptional 47.6% |
| Immigrants | Denmark | 90.9 /100 | #113 | Exceptional 47.6% |
| South Africans | 90.5 /100 | #114 | Exceptional 47.6% |
| Immigrants | Indonesia | 90.5 /100 | #115 | Exceptional 47.6% |
| Palestinians | 90.4 /100 | #116 | Exceptional 47.6% |
| Puget Sound Salish | 90.3 /100 | #117 | Exceptional 47.6% |
| Immigrants | Philippines | 90.2 /100 | #118 | Exceptional 47.6% |
| Australians | 90.2 /100 | #119 | Exceptional 47.6% |
| Syrians | 88.9 /100 | #120 | Excellent 47.5% |