Guyanese vs Immigrants from Latvia Currently Married
COMPARE
Guyanese
Immigrants from Latvia
Currently Married
Currently Married Comparison
Guyanese
Immigrants from Latvia
41.6%
CURRENTLY MARRIED
0.0/ 100
METRIC RATING
310th/ 347
METRIC RANK
46.7%
CURRENTLY MARRIED
56.7/ 100
METRIC RATING
170th/ 347
METRIC RANK
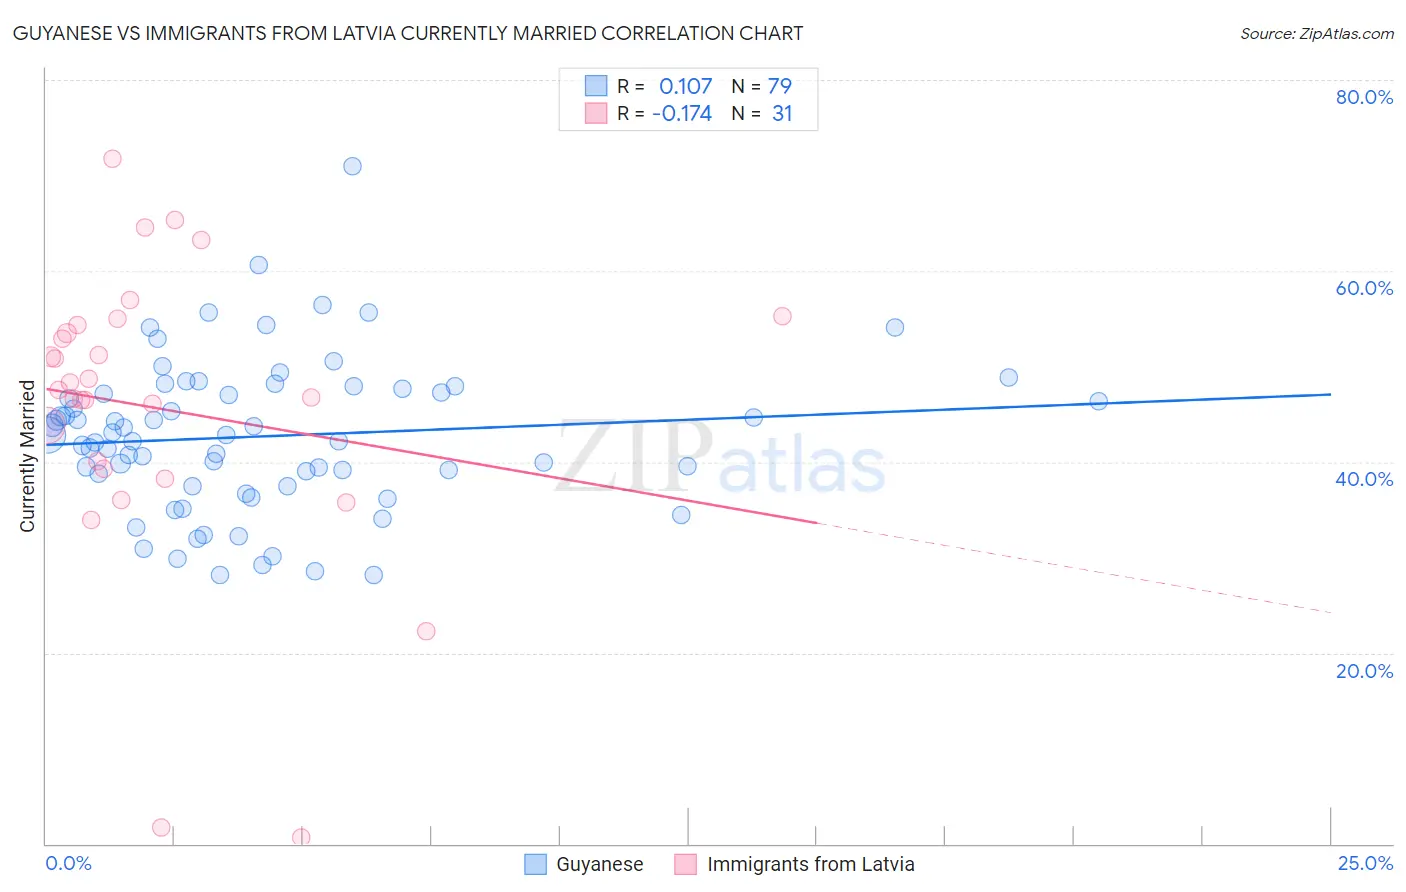
Guyanese vs Immigrants from Latvia Currently Married Correlation Chart
The statistical analysis conducted on geographies consisting of 176,911,764 people shows a poor positive correlation between the proportion of Guyanese and percentage of population currently married in the United States with a correlation coefficient (R) of 0.107 and weighted average of 41.6%. Similarly, the statistical analysis conducted on geographies consisting of 113,738,689 people shows a poor negative correlation between the proportion of Immigrants from Latvia and percentage of population currently married in the United States with a correlation coefficient (R) of -0.174 and weighted average of 46.7%, a difference of 12.3%.
Currently Married Correlation Summary
| Measurement | Guyanese | Immigrants from Latvia |
| Minimum | 28.1% | 0.60% |
| Maximum | 71.0% | 71.8% |
| Range | 42.9% | 71.2% |
| Mean | 42.7% | 45.6% |
| Median | 42.8% | 47.6% |
| Interquartile 25% (IQ1) | 37.5% | 39.3% |
| Interquartile 75% (IQ3) | 47.7% | 54.3% |
| Interquartile Range (IQR) | 10.2% | 15.0% |
| Standard Deviation (Sample) | 7.9% | 15.6% |
| Standard Deviation (Population) | 7.9% | 15.4% |
Similar Demographics by Currently Married
Demographics Similar to Guyanese by Currently Married
In terms of currently married, the demographic groups most similar to Guyanese are Trinidadian and Tobagonian (41.5%, a difference of 0.15%), Somali (41.5%, a difference of 0.33%), Immigrants from Liberia (41.8%, a difference of 0.36%), Immigrants from Belize (41.8%, a difference of 0.48%), and African (41.8%, a difference of 0.52%).
| Demographics | Rating | Rank | Currently Married |
| Sioux | 0.0 /100 | #303 | Tragic 41.9% |
| Immigrants | Bahamas | 0.0 /100 | #304 | Tragic 41.9% |
| Immigrants | Trinidad and Tobago | 0.0 /100 | #305 | Tragic 41.9% |
| Immigrants | Guyana | 0.0 /100 | #306 | Tragic 41.9% |
| Africans | 0.0 /100 | #307 | Tragic 41.8% |
| Immigrants | Belize | 0.0 /100 | #308 | Tragic 41.8% |
| Immigrants | Liberia | 0.0 /100 | #309 | Tragic 41.8% |
| Guyanese | 0.0 /100 | #310 | Tragic 41.6% |
| Trinidadians and Tobagonians | 0.0 /100 | #311 | Tragic 41.5% |
| Somalis | 0.0 /100 | #312 | Tragic 41.5% |
| Jamaicans | 0.0 /100 | #313 | Tragic 41.4% |
| West Indians | 0.0 /100 | #314 | Tragic 41.3% |
| Inupiat | 0.0 /100 | #315 | Tragic 41.3% |
| Immigrants | Caribbean | 0.0 /100 | #316 | Tragic 41.3% |
| Haitians | 0.0 /100 | #317 | Tragic 41.3% |
Demographics Similar to Immigrants from Latvia by Currently Married
In terms of currently married, the demographic groups most similar to Immigrants from Latvia are Armenian (46.8%, a difference of 0.050%), Immigrants from Afghanistan (46.8%, a difference of 0.060%), Spaniard (46.8%, a difference of 0.080%), Immigrants from Syria (46.8%, a difference of 0.10%), and Samoan (46.8%, a difference of 0.11%).
| Demographics | Rating | Rank | Currently Married |
| Delaware | 64.7 /100 | #163 | Good 46.9% |
| Immigrants | Western Asia | 64.2 /100 | #164 | Good 46.9% |
| Samoans | 59.8 /100 | #165 | Average 46.8% |
| Immigrants | Syria | 59.3 /100 | #166 | Average 46.8% |
| Spaniards | 58.8 /100 | #167 | Average 46.8% |
| Immigrants | Afghanistan | 58.2 /100 | #168 | Average 46.8% |
| Armenians | 58.2 /100 | #169 | Average 46.8% |
| Immigrants | Latvia | 56.7 /100 | #170 | Average 46.7% |
| Immigrants | Zimbabwe | 52.4 /100 | #171 | Average 46.7% |
| Aleuts | 52.0 /100 | #172 | Average 46.7% |
| Tlingit-Haida | 51.2 /100 | #173 | Average 46.7% |
| Peruvians | 50.0 /100 | #174 | Average 46.6% |
| Immigrants | Brazil | 49.9 /100 | #175 | Average 46.6% |
| Hawaiians | 48.6 /100 | #176 | Average 46.6% |
| Israelis | 48.6 /100 | #177 | Average 46.6% |