Guatemalan vs Immigrants from Uganda Married-couple Households
COMPARE
Guatemalan
Immigrants from Uganda
Married-couple Households
Married-couple Households Comparison
Guatemalans
Immigrants from Uganda
43.3%
MARRIED-COUPLE HOUSEHOLDS
0.1/ 100
METRIC RATING
271st/ 347
METRIC RANK
44.6%
MARRIED-COUPLE HOUSEHOLDS
1.5/ 100
METRIC RATING
233rd/ 347
METRIC RANK
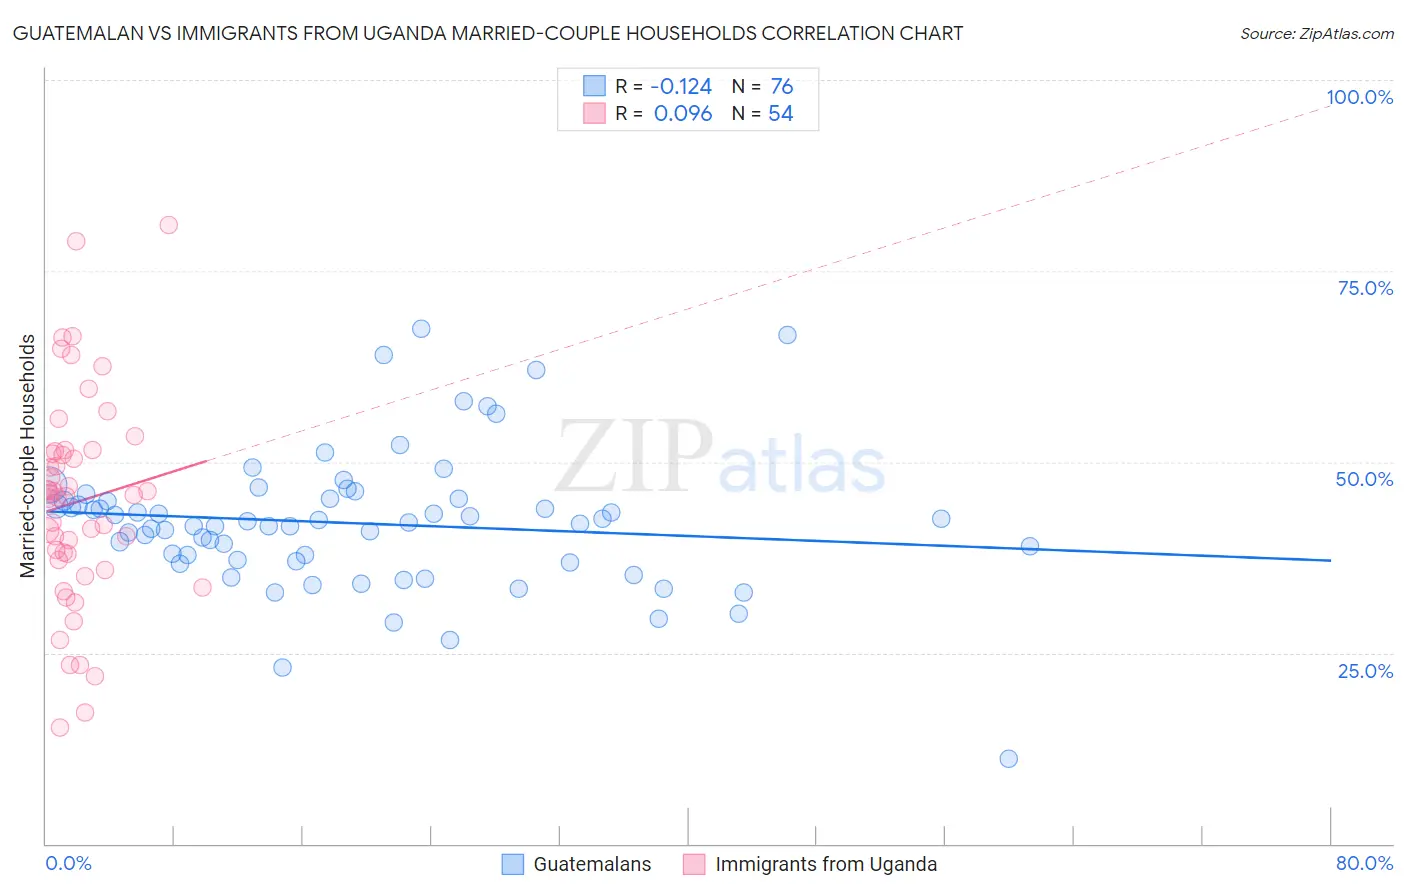
Guatemalan vs Immigrants from Uganda Married-couple Households Correlation Chart
The statistical analysis conducted on geographies consisting of 409,284,876 people shows a poor negative correlation between the proportion of Guatemalans and percentage of married-couple family households in the United States with a correlation coefficient (R) of -0.124 and weighted average of 43.3%. Similarly, the statistical analysis conducted on geographies consisting of 125,974,849 people shows a slight positive correlation between the proportion of Immigrants from Uganda and percentage of married-couple family households in the United States with a correlation coefficient (R) of 0.096 and weighted average of 44.6%, a difference of 3.1%.
Married-couple Households Correlation Summary
| Measurement | Guatemalan | Immigrants from Uganda |
| Minimum | 11.2% | 15.2% |
| Maximum | 67.5% | 81.0% |
| Range | 56.3% | 65.8% |
| Mean | 42.0% | 44.8% |
| Median | 41.9% | 45.6% |
| Interquartile 25% (IQ1) | 37.1% | 37.2% |
| Interquartile 75% (IQ3) | 45.1% | 51.4% |
| Interquartile Range (IQR) | 8.0% | 14.2% |
| Standard Deviation (Sample) | 9.1% | 13.8% |
| Standard Deviation (Population) | 9.0% | 13.7% |
Similar Demographics by Married-couple Households
Demographics Similar to Guatemalans by Married-couple Households
In terms of married-couple households, the demographic groups most similar to Guatemalans are Yuman (43.3%, a difference of 0.11%), Immigrants from Nigeria (43.2%, a difference of 0.11%), Immigrants from Sierra Leone (43.3%, a difference of 0.15%), Ethiopian (43.2%, a difference of 0.20%), and Nigerian (43.2%, a difference of 0.21%).
| Demographics | Rating | Rank | Married-couple Households |
| Bangladeshis | 0.1 /100 | #264 | Tragic 43.5% |
| Moroccans | 0.1 /100 | #265 | Tragic 43.5% |
| Ecuadorians | 0.1 /100 | #266 | Tragic 43.5% |
| Natives/Alaskans | 0.1 /100 | #267 | Tragic 43.5% |
| Immigrants | Burma/Myanmar | 0.1 /100 | #268 | Tragic 43.4% |
| Immigrants | Sierra Leone | 0.1 /100 | #269 | Tragic 43.3% |
| Yuman | 0.1 /100 | #270 | Tragic 43.3% |
| Guatemalans | 0.1 /100 | #271 | Tragic 43.3% |
| Immigrants | Nigeria | 0.1 /100 | #272 | Tragic 43.2% |
| Ethiopians | 0.1 /100 | #273 | Tragic 43.2% |
| Nigerians | 0.1 /100 | #274 | Tragic 43.2% |
| Immigrants | Bangladesh | 0.0 /100 | #275 | Tragic 43.1% |
| Immigrants | Ethiopia | 0.0 /100 | #276 | Tragic 43.1% |
| Immigrants | Eastern Africa | 0.0 /100 | #277 | Tragic 42.9% |
| Immigrants | Africa | 0.0 /100 | #278 | Tragic 42.9% |
Demographics Similar to Immigrants from Uganda by Married-couple Households
In terms of married-couple households, the demographic groups most similar to Immigrants from Uganda are Houma (44.6%, a difference of 0.040%), Marshallese (44.6%, a difference of 0.040%), Soviet Union (44.6%, a difference of 0.050%), Immigrants from Latin America (44.7%, a difference of 0.090%), and Immigrants from Panama (44.6%, a difference of 0.12%).
| Demographics | Rating | Rank | Married-couple Households |
| Alsatians | 2.3 /100 | #226 | Tragic 44.8% |
| Salvadorans | 1.9 /100 | #227 | Tragic 44.7% |
| Kenyans | 1.7 /100 | #228 | Tragic 44.7% |
| Immigrants | Latin America | 1.6 /100 | #229 | Tragic 44.7% |
| Soviet Union | 1.6 /100 | #230 | Tragic 44.6% |
| Houma | 1.5 /100 | #231 | Tragic 44.6% |
| Marshallese | 1.5 /100 | #232 | Tragic 44.6% |
| Immigrants | Uganda | 1.5 /100 | #233 | Tragic 44.6% |
| Immigrants | Panama | 1.3 /100 | #234 | Tragic 44.6% |
| Immigrants | Nicaragua | 1.2 /100 | #235 | Tragic 44.5% |
| Yaqui | 1.2 /100 | #236 | Tragic 44.5% |
| Comanche | 1.2 /100 | #237 | Tragic 44.5% |
| Immigrants | Uruguay | 1.1 /100 | #238 | Tragic 44.5% |
| Spanish Americans | 1.1 /100 | #239 | Tragic 44.5% |
| Ute | 1.0 /100 | #240 | Tragic 44.4% |