Guatemalan vs Danish Married-couple Households
COMPARE
Guatemalan
Danish
Married-couple Households
Married-couple Households Comparison
Guatemalans
Danes
43.3%
MARRIED-COUPLE HOUSEHOLDS
0.1/ 100
METRIC RATING
271st/ 347
METRIC RANK
51.1%
MARRIED-COUPLE HOUSEHOLDS
100.0/ 100
METRIC RATING
6th/ 347
METRIC RANK
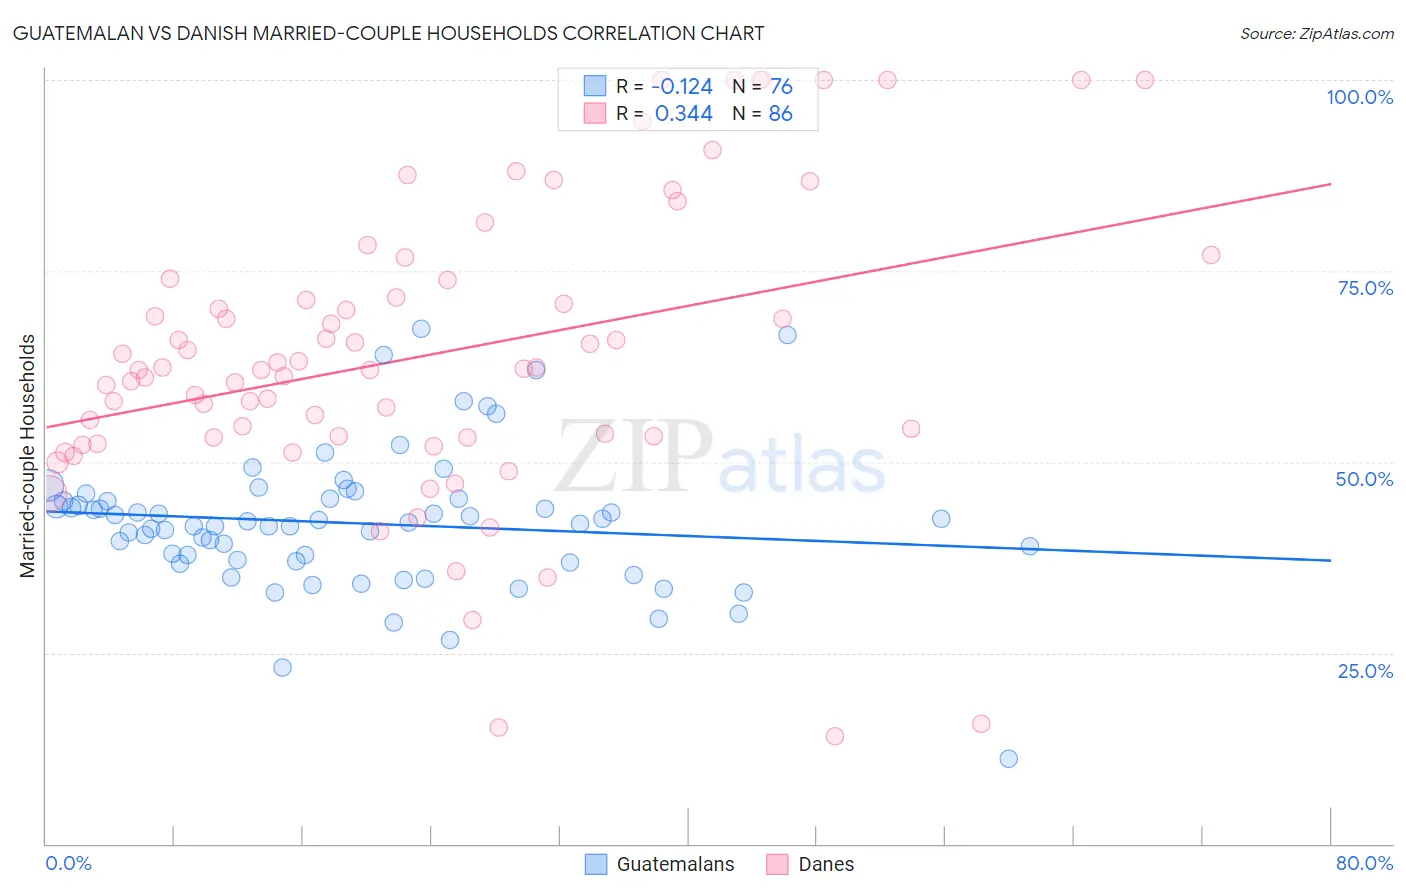
Guatemalan vs Danish Married-couple Households Correlation Chart
The statistical analysis conducted on geographies consisting of 409,284,876 people shows a poor negative correlation between the proportion of Guatemalans and percentage of married-couple family households in the United States with a correlation coefficient (R) of -0.124 and weighted average of 43.3%. Similarly, the statistical analysis conducted on geographies consisting of 473,893,305 people shows a mild positive correlation between the proportion of Danes and percentage of married-couple family households in the United States with a correlation coefficient (R) of 0.344 and weighted average of 51.1%, a difference of 18.1%.
Married-couple Households Correlation Summary
| Measurement | Guatemalan | Danish |
| Minimum | 11.2% | 14.0% |
| Maximum | 67.5% | 100.0% |
| Range | 56.3% | 86.0% |
| Mean | 42.0% | 64.0% |
| Median | 41.9% | 62.1% |
| Interquartile 25% (IQ1) | 37.1% | 53.2% |
| Interquartile 75% (IQ3) | 45.1% | 73.9% |
| Interquartile Range (IQR) | 8.0% | 20.6% |
| Standard Deviation (Sample) | 9.1% | 19.2% |
| Standard Deviation (Population) | 9.0% | 19.1% |
Similar Demographics by Married-couple Households
Demographics Similar to Guatemalans by Married-couple Households
In terms of married-couple households, the demographic groups most similar to Guatemalans are Yuman (43.3%, a difference of 0.11%), Immigrants from Nigeria (43.2%, a difference of 0.11%), Immigrants from Sierra Leone (43.3%, a difference of 0.15%), Ethiopian (43.2%, a difference of 0.20%), and Nigerian (43.2%, a difference of 0.21%).
| Demographics | Rating | Rank | Married-couple Households |
| Bangladeshis | 0.1 /100 | #264 | Tragic 43.5% |
| Moroccans | 0.1 /100 | #265 | Tragic 43.5% |
| Ecuadorians | 0.1 /100 | #266 | Tragic 43.5% |
| Natives/Alaskans | 0.1 /100 | #267 | Tragic 43.5% |
| Immigrants | Burma/Myanmar | 0.1 /100 | #268 | Tragic 43.4% |
| Immigrants | Sierra Leone | 0.1 /100 | #269 | Tragic 43.3% |
| Yuman | 0.1 /100 | #270 | Tragic 43.3% |
| Guatemalans | 0.1 /100 | #271 | Tragic 43.3% |
| Immigrants | Nigeria | 0.1 /100 | #272 | Tragic 43.2% |
| Ethiopians | 0.1 /100 | #273 | Tragic 43.2% |
| Nigerians | 0.1 /100 | #274 | Tragic 43.2% |
| Immigrants | Bangladesh | 0.0 /100 | #275 | Tragic 43.1% |
| Immigrants | Ethiopia | 0.0 /100 | #276 | Tragic 43.1% |
| Immigrants | Eastern Africa | 0.0 /100 | #277 | Tragic 42.9% |
| Immigrants | Africa | 0.0 /100 | #278 | Tragic 42.9% |
Demographics Similar to Danes by Married-couple Households
In terms of married-couple households, the demographic groups most similar to Danes are Filipino (51.0%, a difference of 0.22%), Immigrants from South Central Asia (50.6%, a difference of 0.86%), Tongan (51.6%, a difference of 0.98%), Pennsylvania German (50.4%, a difference of 1.4%), and Chinese (50.4%, a difference of 1.4%).
| Demographics | Rating | Rank | Married-couple Households |
| Immigrants | India | 100.0 /100 | #1 | Exceptional 52.7% |
| Immigrants | Taiwan | 100.0 /100 | #2 | Exceptional 52.4% |
| Thais | 100.0 /100 | #3 | Exceptional 51.9% |
| Assyrians/Chaldeans/Syriacs | 100.0 /100 | #4 | Exceptional 51.8% |
| Tongans | 100.0 /100 | #5 | Exceptional 51.6% |
| Danes | 100.0 /100 | #6 | Exceptional 51.1% |
| Filipinos | 100.0 /100 | #7 | Exceptional 51.0% |
| Immigrants | South Central Asia | 100.0 /100 | #8 | Exceptional 50.6% |
| Pennsylvania Germans | 100.0 /100 | #9 | Exceptional 50.4% |
| Chinese | 100.0 /100 | #10 | Exceptional 50.4% |
| Immigrants | Pakistan | 100.0 /100 | #11 | Exceptional 50.1% |
| Swiss | 100.0 /100 | #12 | Exceptional 49.9% |
| Immigrants | Korea | 100.0 /100 | #13 | Exceptional 49.9% |
| Burmese | 100.0 /100 | #14 | Exceptional 49.8% |
| Koreans | 99.9 /100 | #15 | Exceptional 49.7% |