Central American vs Immigrants from Uganda Married-couple Households
COMPARE
Central American
Immigrants from Uganda
Married-couple Households
Married-couple Households Comparison
Central Americans
Immigrants from Uganda
43.9%
MARRIED-COUPLE HOUSEHOLDS
0.3/ 100
METRIC RATING
253rd/ 347
METRIC RANK
44.6%
MARRIED-COUPLE HOUSEHOLDS
1.5/ 100
METRIC RATING
233rd/ 347
METRIC RANK
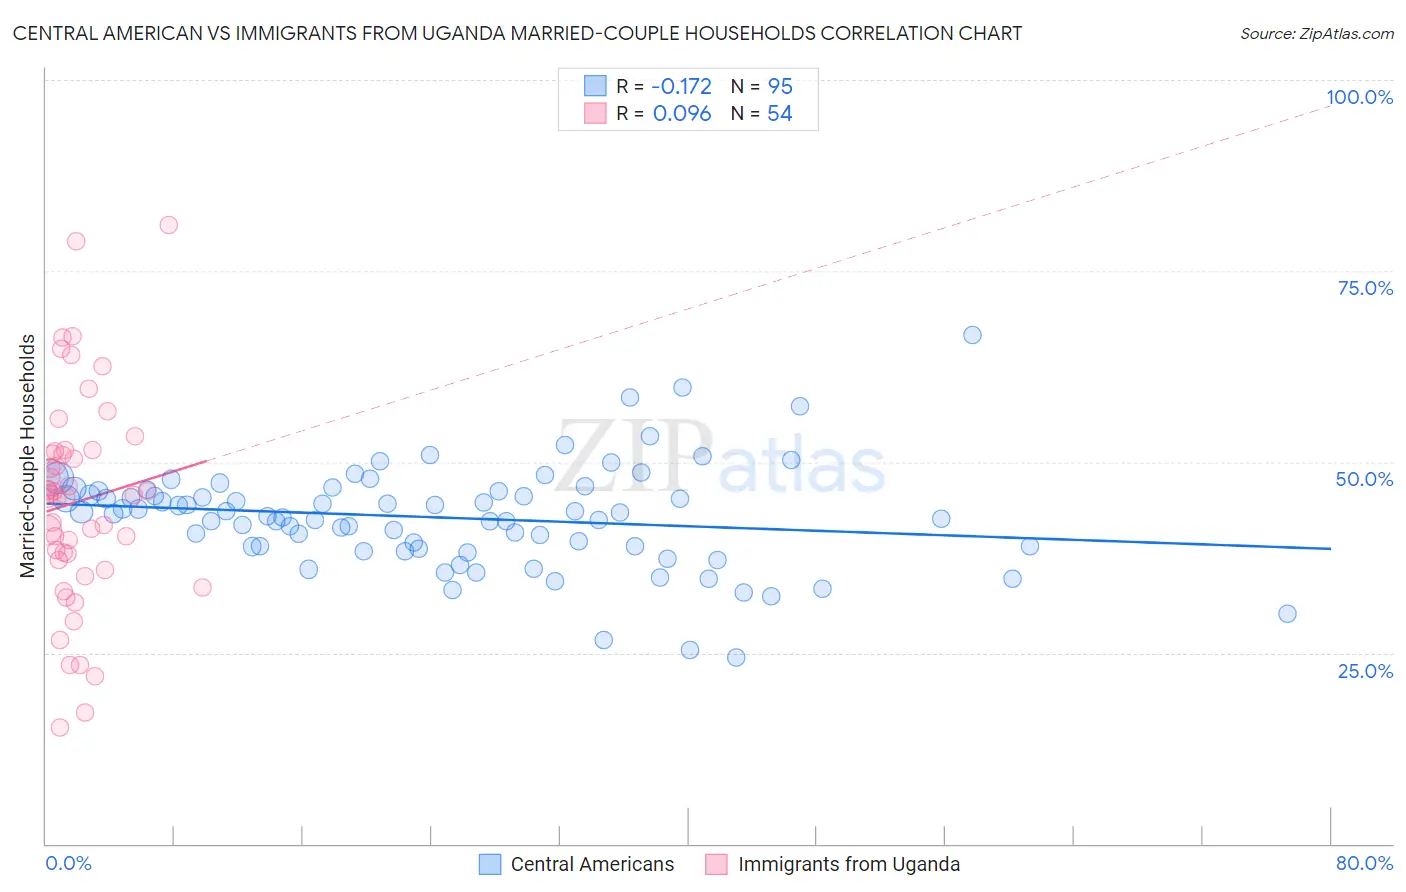
Central American vs Immigrants from Uganda Married-couple Households Correlation Chart
The statistical analysis conducted on geographies consisting of 504,046,022 people shows a poor negative correlation between the proportion of Central Americans and percentage of married-couple family households in the United States with a correlation coefficient (R) of -0.172 and weighted average of 43.9%. Similarly, the statistical analysis conducted on geographies consisting of 125,974,849 people shows a slight positive correlation between the proportion of Immigrants from Uganda and percentage of married-couple family households in the United States with a correlation coefficient (R) of 0.096 and weighted average of 44.6%, a difference of 1.5%.
Married-couple Households Correlation Summary
| Measurement | Central American | Immigrants from Uganda |
| Minimum | 24.4% | 15.2% |
| Maximum | 66.7% | 81.0% |
| Range | 42.3% | 65.8% |
| Mean | 42.7% | 44.8% |
| Median | 43.2% | 45.6% |
| Interquartile 25% (IQ1) | 38.9% | 37.2% |
| Interquartile 75% (IQ3) | 46.2% | 51.4% |
| Interquartile Range (IQR) | 7.3% | 14.2% |
| Standard Deviation (Sample) | 6.8% | 13.8% |
| Standard Deviation (Population) | 6.8% | 13.7% |
Demographics Similar to Central Americans and Immigrants from Uganda by Married-couple Households
In terms of married-couple households, the demographic groups most similar to Central Americans are Seminole (44.0%, a difference of 0.12%), German Russian (44.0%, a difference of 0.19%), French American Indian (44.1%, a difference of 0.27%), Immigrants from Kenya (44.1%, a difference of 0.28%), and Yup'ik (44.1%, a difference of 0.32%). Similarly, the demographic groups most similar to Immigrants from Uganda are Immigrants from Panama (44.6%, a difference of 0.12%), Immigrants from Nicaragua (44.5%, a difference of 0.19%), Yaqui (44.5%, a difference of 0.20%), Comanche (44.5%, a difference of 0.23%), and Immigrants from Uruguay (44.5%, a difference of 0.28%).
| Demographics | Rating | Rank | Married-couple Households |
| Immigrants | Uganda | 1.5 /100 | #233 | Tragic 44.6% |
| Immigrants | Panama | 1.3 /100 | #234 | Tragic 44.6% |
| Immigrants | Nicaragua | 1.2 /100 | #235 | Tragic 44.5% |
| Yaqui | 1.2 /100 | #236 | Tragic 44.5% |
| Comanche | 1.2 /100 | #237 | Tragic 44.5% |
| Immigrants | Uruguay | 1.1 /100 | #238 | Tragic 44.5% |
| Spanish Americans | 1.1 /100 | #239 | Tragic 44.5% |
| Ute | 1.0 /100 | #240 | Tragic 44.4% |
| Immigrants | Bosnia and Herzegovina | 1.0 /100 | #241 | Tragic 44.4% |
| Immigrants | Albania | 1.0 /100 | #242 | Tragic 44.4% |
| Immigrants | Saudi Arabia | 0.9 /100 | #243 | Tragic 44.4% |
| Immigrants | Armenia | 0.7 /100 | #244 | Tragic 44.3% |
| Immigrants | El Salvador | 0.7 /100 | #245 | Tragic 44.3% |
| Immigrants | Cuba | 0.6 /100 | #246 | Tragic 44.2% |
| Immigrants | Morocco | 0.6 /100 | #247 | Tragic 44.2% |
| Yup'ik | 0.4 /100 | #248 | Tragic 44.1% |
| Immigrants | Kenya | 0.4 /100 | #249 | Tragic 44.1% |
| French American Indians | 0.4 /100 | #250 | Tragic 44.1% |
| German Russians | 0.4 /100 | #251 | Tragic 44.0% |
| Seminole | 0.4 /100 | #252 | Tragic 44.0% |
| Central Americans | 0.3 /100 | #253 | Tragic 43.9% |