Marshallese vs Immigrants from Uganda Married-couple Households
COMPARE
Marshallese
Immigrants from Uganda
Married-couple Households
Married-couple Households Comparison
Marshallese
Immigrants from Uganda
44.6%
MARRIED-COUPLE HOUSEHOLDS
1.5/ 100
METRIC RATING
232nd/ 347
METRIC RANK
44.6%
MARRIED-COUPLE HOUSEHOLDS
1.5/ 100
METRIC RATING
233rd/ 347
METRIC RANK
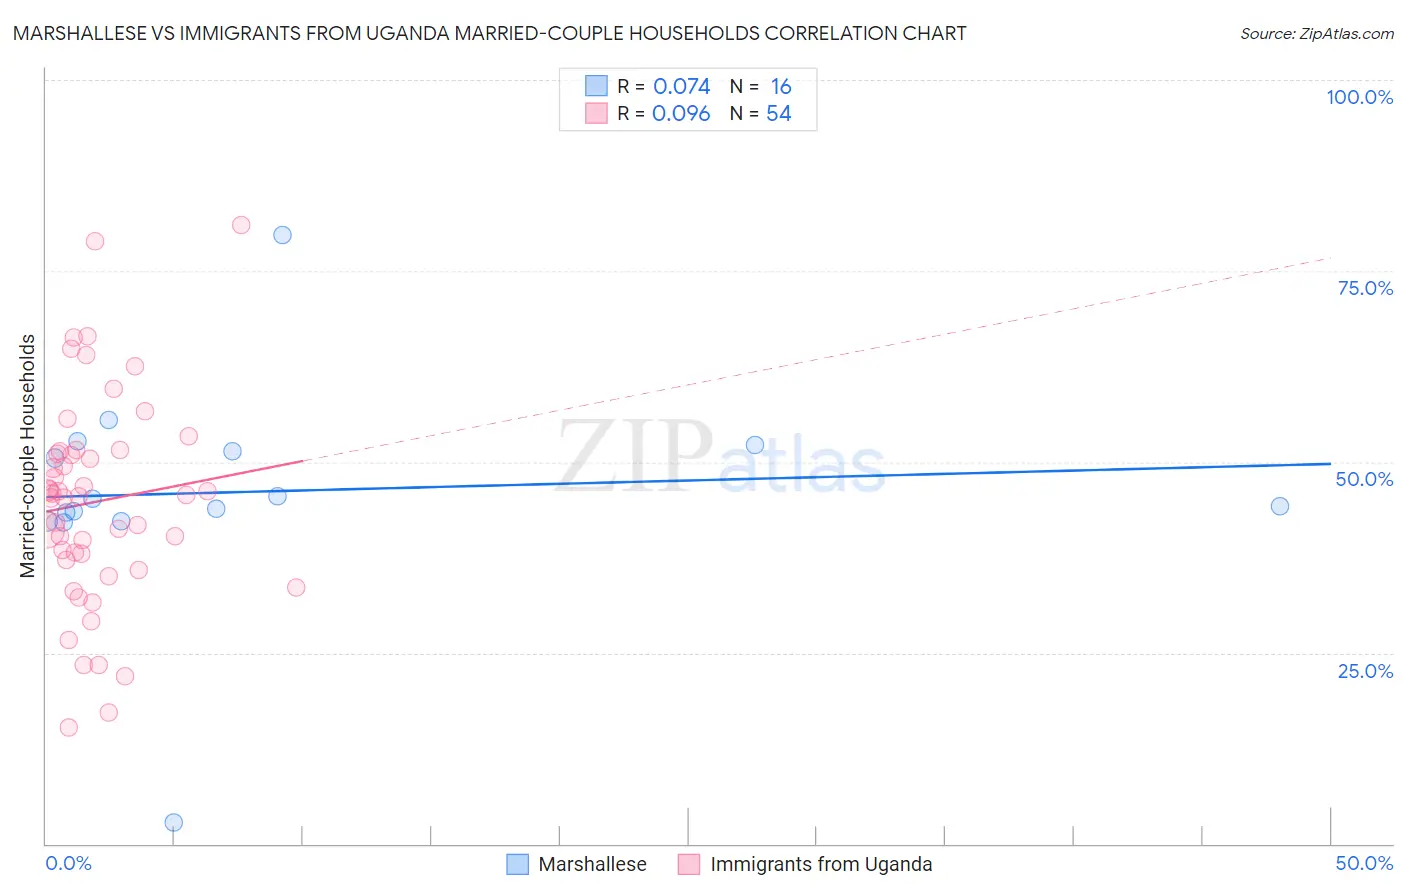
Marshallese vs Immigrants from Uganda Married-couple Households Correlation Chart
The statistical analysis conducted on geographies consisting of 14,761,315 people shows a slight positive correlation between the proportion of Marshallese and percentage of married-couple family households in the United States with a correlation coefficient (R) of 0.074 and weighted average of 44.6%. Similarly, the statistical analysis conducted on geographies consisting of 125,974,849 people shows a slight positive correlation between the proportion of Immigrants from Uganda and percentage of married-couple family households in the United States with a correlation coefficient (R) of 0.096 and weighted average of 44.6%, a difference of 0.040%.
Married-couple Households Correlation Summary
| Measurement | Marshallese | Immigrants from Uganda |
| Minimum | 2.9% | 15.2% |
| Maximum | 79.7% | 81.0% |
| Range | 76.9% | 65.8% |
| Mean | 46.1% | 44.8% |
| Median | 44.7% | 45.6% |
| Interquartile 25% (IQ1) | 42.8% | 37.2% |
| Interquartile 75% (IQ3) | 51.8% | 51.4% |
| Interquartile Range (IQR) | 9.0% | 14.2% |
| Standard Deviation (Sample) | 14.8% | 13.8% |
| Standard Deviation (Population) | 14.3% | 13.7% |
Demographics Similar to Marshallese and Immigrants from Uganda by Married-couple Households
In terms of married-couple households, the demographic groups most similar to Marshallese are Houma (44.6%, a difference of 0.0%), Soviet Union (44.6%, a difference of 0.010%), Immigrants from Latin America (44.7%, a difference of 0.050%), Kenyan (44.7%, a difference of 0.10%), and Immigrants from Panama (44.6%, a difference of 0.16%). Similarly, the demographic groups most similar to Immigrants from Uganda are Houma (44.6%, a difference of 0.040%), Soviet Union (44.6%, a difference of 0.050%), Immigrants from Latin America (44.7%, a difference of 0.090%), Immigrants from Panama (44.6%, a difference of 0.12%), and Kenyan (44.7%, a difference of 0.14%).
| Demographics | Rating | Rank | Married-couple Households |
| Immigrants | Laos | 4.6 /100 | #222 | Tragic 45.1% |
| Immigrants | Cambodia | 2.7 /100 | #223 | Tragic 44.9% |
| Immigrants | Micronesia | 2.6 /100 | #224 | Tragic 44.9% |
| Dutch West Indians | 2.6 /100 | #225 | Tragic 44.9% |
| Alsatians | 2.3 /100 | #226 | Tragic 44.8% |
| Salvadorans | 1.9 /100 | #227 | Tragic 44.7% |
| Kenyans | 1.7 /100 | #228 | Tragic 44.7% |
| Immigrants | Latin America | 1.6 /100 | #229 | Tragic 44.7% |
| Soviet Union | 1.6 /100 | #230 | Tragic 44.6% |
| Houma | 1.5 /100 | #231 | Tragic 44.6% |
| Marshallese | 1.5 /100 | #232 | Tragic 44.6% |
| Immigrants | Uganda | 1.5 /100 | #233 | Tragic 44.6% |
| Immigrants | Panama | 1.3 /100 | #234 | Tragic 44.6% |
| Immigrants | Nicaragua | 1.2 /100 | #235 | Tragic 44.5% |
| Yaqui | 1.2 /100 | #236 | Tragic 44.5% |
| Comanche | 1.2 /100 | #237 | Tragic 44.5% |
| Immigrants | Uruguay | 1.1 /100 | #238 | Tragic 44.5% |
| Spanish Americans | 1.1 /100 | #239 | Tragic 44.5% |
| Ute | 1.0 /100 | #240 | Tragic 44.4% |
| Immigrants | Bosnia and Herzegovina | 1.0 /100 | #241 | Tragic 44.4% |
| Immigrants | Albania | 1.0 /100 | #242 | Tragic 44.4% |