Guatemalan vs Albanian Married-couple Households
COMPARE
Guatemalan
Albanian
Married-couple Households
Married-couple Households Comparison
Guatemalans
Albanians
43.3%
MARRIED-COUPLE HOUSEHOLDS
0.1/ 100
METRIC RATING
271st/ 347
METRIC RANK
46.1%
MARRIED-COUPLE HOUSEHOLDS
31.1/ 100
METRIC RATING
186th/ 347
METRIC RANK
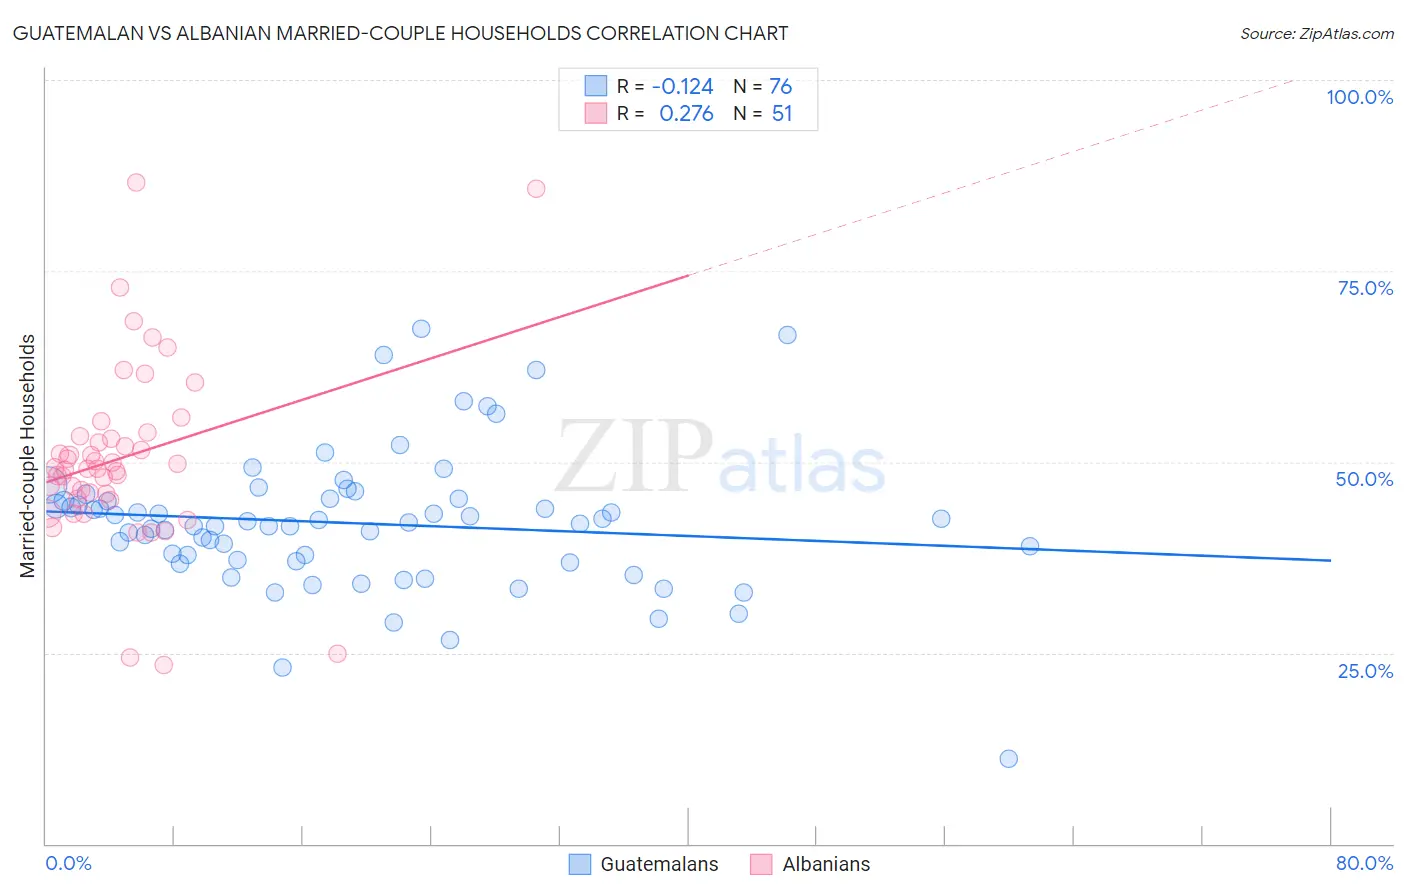
Guatemalan vs Albanian Married-couple Households Correlation Chart
The statistical analysis conducted on geographies consisting of 409,284,876 people shows a poor negative correlation between the proportion of Guatemalans and percentage of married-couple family households in the United States with a correlation coefficient (R) of -0.124 and weighted average of 43.3%. Similarly, the statistical analysis conducted on geographies consisting of 193,184,861 people shows a weak positive correlation between the proportion of Albanians and percentage of married-couple family households in the United States with a correlation coefficient (R) of 0.276 and weighted average of 46.1%, a difference of 6.6%.
Married-couple Households Correlation Summary
| Measurement | Guatemalan | Albanian |
| Minimum | 11.2% | 23.4% |
| Maximum | 67.5% | 86.6% |
| Range | 56.3% | 63.2% |
| Mean | 42.0% | 50.5% |
| Median | 41.9% | 49.1% |
| Interquartile 25% (IQ1) | 37.1% | 45.2% |
| Interquartile 75% (IQ3) | 45.1% | 53.3% |
| Interquartile Range (IQR) | 8.0% | 8.1% |
| Standard Deviation (Sample) | 9.1% | 11.9% |
| Standard Deviation (Population) | 9.0% | 11.8% |
Similar Demographics by Married-couple Households
Demographics Similar to Guatemalans by Married-couple Households
In terms of married-couple households, the demographic groups most similar to Guatemalans are Yuman (43.3%, a difference of 0.11%), Immigrants from Nigeria (43.2%, a difference of 0.11%), Immigrants from Sierra Leone (43.3%, a difference of 0.15%), Ethiopian (43.2%, a difference of 0.20%), and Nigerian (43.2%, a difference of 0.21%).
| Demographics | Rating | Rank | Married-couple Households |
| Bangladeshis | 0.1 /100 | #264 | Tragic 43.5% |
| Moroccans | 0.1 /100 | #265 | Tragic 43.5% |
| Ecuadorians | 0.1 /100 | #266 | Tragic 43.5% |
| Natives/Alaskans | 0.1 /100 | #267 | Tragic 43.5% |
| Immigrants | Burma/Myanmar | 0.1 /100 | #268 | Tragic 43.4% |
| Immigrants | Sierra Leone | 0.1 /100 | #269 | Tragic 43.3% |
| Yuman | 0.1 /100 | #270 | Tragic 43.3% |
| Guatemalans | 0.1 /100 | #271 | Tragic 43.3% |
| Immigrants | Nigeria | 0.1 /100 | #272 | Tragic 43.2% |
| Ethiopians | 0.1 /100 | #273 | Tragic 43.2% |
| Nigerians | 0.1 /100 | #274 | Tragic 43.2% |
| Immigrants | Bangladesh | 0.0 /100 | #275 | Tragic 43.1% |
| Immigrants | Ethiopia | 0.0 /100 | #276 | Tragic 43.1% |
| Immigrants | Eastern Africa | 0.0 /100 | #277 | Tragic 42.9% |
| Immigrants | Africa | 0.0 /100 | #278 | Tragic 42.9% |
Demographics Similar to Albanians by Married-couple Households
In terms of married-couple households, the demographic groups most similar to Albanians are Fijian (46.1%, a difference of 0.080%), South American Indian (46.0%, a difference of 0.13%), Brazilian (46.2%, a difference of 0.20%), Immigrants from Latvia (46.0%, a difference of 0.20%), and Immigrants from Switzerland (46.2%, a difference of 0.24%).
| Demographics | Rating | Rank | Married-couple Households |
| Immigrants | Zimbabwe | 43.0 /100 | #179 | Average 46.3% |
| Mongolians | 42.0 /100 | #180 | Average 46.3% |
| Malaysians | 41.8 /100 | #181 | Average 46.3% |
| Yugoslavians | 38.9 /100 | #182 | Fair 46.2% |
| Immigrants | Brazil | 38.3 /100 | #183 | Fair 46.2% |
| Immigrants | Switzerland | 36.9 /100 | #184 | Fair 46.2% |
| Brazilians | 35.9 /100 | #185 | Fair 46.2% |
| Albanians | 31.1 /100 | #186 | Fair 46.1% |
| Fijians | 29.2 /100 | #187 | Fair 46.1% |
| South American Indians | 28.4 /100 | #188 | Fair 46.0% |
| Immigrants | Latvia | 26.9 /100 | #189 | Fair 46.0% |
| Immigrants | Kuwait | 25.6 /100 | #190 | Fair 46.0% |
| Choctaw | 24.9 /100 | #191 | Fair 46.0% |
| Immigrants | Northern Africa | 24.6 /100 | #192 | Fair 46.0% |
| Taiwanese | 23.4 /100 | #193 | Fair 45.9% |