Puget Sound Salish vs Immigrants from Uganda Married-couple Households
COMPARE
Puget Sound Salish
Immigrants from Uganda
Married-couple Households
Married-couple Households Comparison
Puget Sound Salish
Immigrants from Uganda
47.4%
MARRIED-COUPLE HOUSEHOLDS
90.5/ 100
METRIC RATING
120th/ 347
METRIC RANK
44.6%
MARRIED-COUPLE HOUSEHOLDS
1.5/ 100
METRIC RATING
233rd/ 347
METRIC RANK
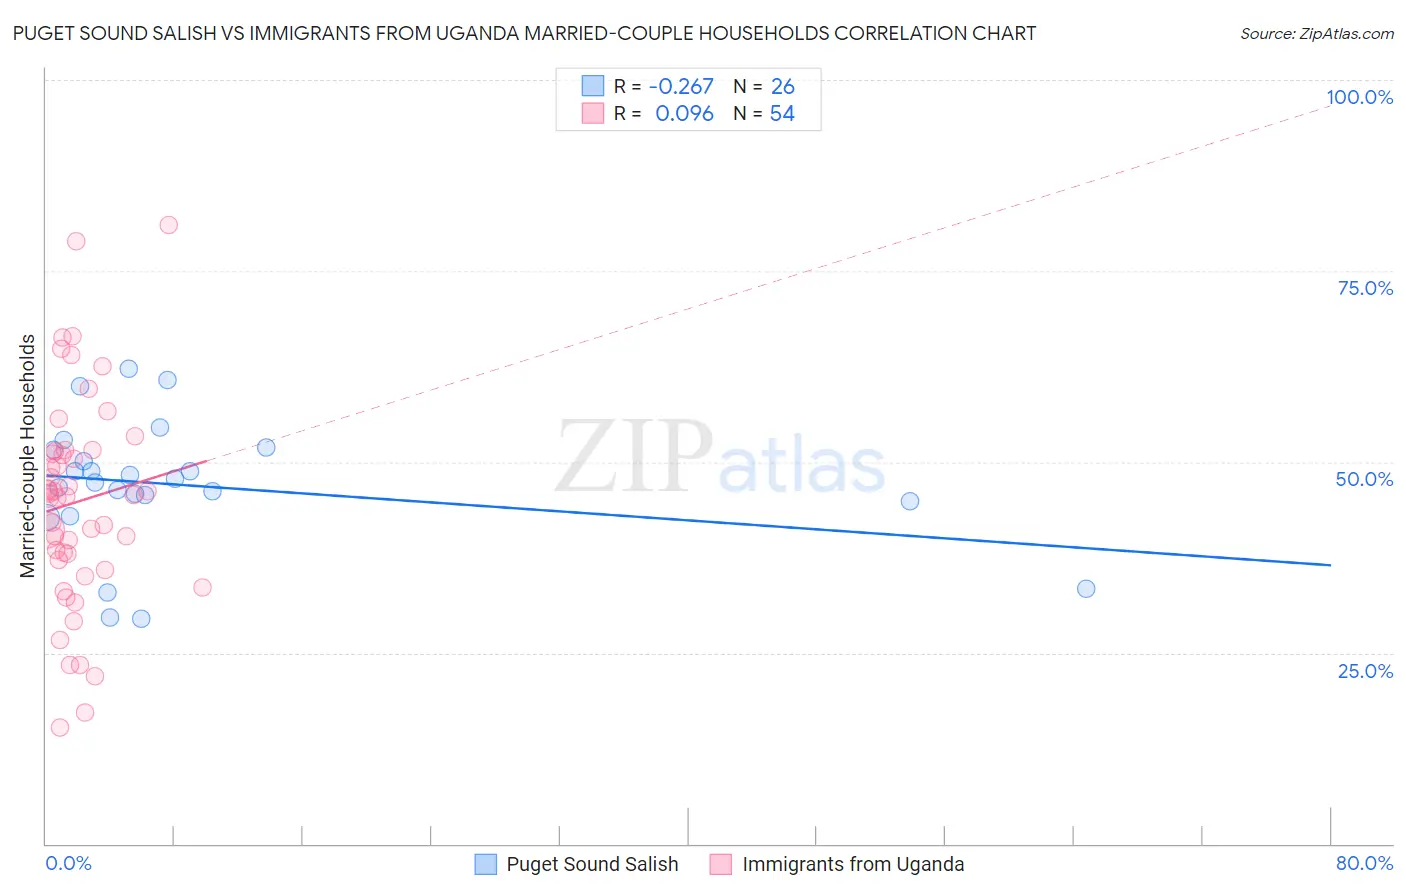
Puget Sound Salish vs Immigrants from Uganda Married-couple Households Correlation Chart
The statistical analysis conducted on geographies consisting of 46,155,865 people shows a weak negative correlation between the proportion of Puget Sound Salish and percentage of married-couple family households in the United States with a correlation coefficient (R) of -0.267 and weighted average of 47.4%. Similarly, the statistical analysis conducted on geographies consisting of 125,974,849 people shows a slight positive correlation between the proportion of Immigrants from Uganda and percentage of married-couple family households in the United States with a correlation coefficient (R) of 0.096 and weighted average of 44.6%, a difference of 6.3%.
Married-couple Households Correlation Summary
| Measurement | Puget Sound Salish | Immigrants from Uganda |
| Minimum | 29.5% | 15.2% |
| Maximum | 62.2% | 81.0% |
| Range | 32.7% | 65.8% |
| Mean | 46.9% | 44.8% |
| Median | 47.6% | 45.6% |
| Interquartile 25% (IQ1) | 44.8% | 37.2% |
| Interquartile 75% (IQ3) | 51.6% | 51.4% |
| Interquartile Range (IQR) | 6.8% | 14.2% |
| Standard Deviation (Sample) | 8.4% | 13.8% |
| Standard Deviation (Population) | 8.3% | 13.7% |
Similar Demographics by Married-couple Households
Demographics Similar to Puget Sound Salish by Married-couple Households
In terms of married-couple households, the demographic groups most similar to Puget Sound Salish are Immigrants from Eastern Europe (47.4%, a difference of 0.020%), Okinawan (47.4%, a difference of 0.040%), Immigrants from Venezuela (47.4%, a difference of 0.13%), Zimbabwean (47.4%, a difference of 0.14%), and Australian (47.4%, a difference of 0.16%).
| Demographics | Rating | Rank | Married-couple Households |
| Venezuelans | 93.8 /100 | #113 | Exceptional 47.6% |
| Immigrants | Europe | 93.7 /100 | #114 | Exceptional 47.6% |
| Slovaks | 92.9 /100 | #115 | Exceptional 47.6% |
| Argentineans | 92.5 /100 | #116 | Exceptional 47.5% |
| French Canadians | 92.4 /100 | #117 | Exceptional 47.5% |
| Immigrants | Germany | 92.4 /100 | #118 | Exceptional 47.5% |
| Chileans | 92.2 /100 | #119 | Exceptional 47.5% |
| Puget Sound Salish | 90.5 /100 | #120 | Exceptional 47.4% |
| Immigrants | Eastern Europe | 90.3 /100 | #121 | Exceptional 47.4% |
| Okinawans | 90.1 /100 | #122 | Exceptional 47.4% |
| Immigrants | Venezuela | 89.3 /100 | #123 | Excellent 47.4% |
| Zimbabweans | 89.2 /100 | #124 | Excellent 47.4% |
| Australians | 89.0 /100 | #125 | Excellent 47.4% |
| Pakistanis | 88.6 /100 | #126 | Excellent 47.3% |
| Celtics | 88.1 /100 | #127 | Excellent 47.3% |
Demographics Similar to Immigrants from Uganda by Married-couple Households
In terms of married-couple households, the demographic groups most similar to Immigrants from Uganda are Houma (44.6%, a difference of 0.040%), Marshallese (44.6%, a difference of 0.040%), Soviet Union (44.6%, a difference of 0.050%), Immigrants from Latin America (44.7%, a difference of 0.090%), and Immigrants from Panama (44.6%, a difference of 0.12%).
| Demographics | Rating | Rank | Married-couple Households |
| Alsatians | 2.3 /100 | #226 | Tragic 44.8% |
| Salvadorans | 1.9 /100 | #227 | Tragic 44.7% |
| Kenyans | 1.7 /100 | #228 | Tragic 44.7% |
| Immigrants | Latin America | 1.6 /100 | #229 | Tragic 44.7% |
| Soviet Union | 1.6 /100 | #230 | Tragic 44.6% |
| Houma | 1.5 /100 | #231 | Tragic 44.6% |
| Marshallese | 1.5 /100 | #232 | Tragic 44.6% |
| Immigrants | Uganda | 1.5 /100 | #233 | Tragic 44.6% |
| Immigrants | Panama | 1.3 /100 | #234 | Tragic 44.6% |
| Immigrants | Nicaragua | 1.2 /100 | #235 | Tragic 44.5% |
| Yaqui | 1.2 /100 | #236 | Tragic 44.5% |
| Comanche | 1.2 /100 | #237 | Tragic 44.5% |
| Immigrants | Uruguay | 1.1 /100 | #238 | Tragic 44.5% |
| Spanish Americans | 1.1 /100 | #239 | Tragic 44.5% |
| Ute | 1.0 /100 | #240 | Tragic 44.4% |