Immigrants from St. Vincent and the Grenadines vs Immigrants from Uganda Married-couple Households
COMPARE
Immigrants from St. Vincent and the Grenadines
Immigrants from Uganda
Married-couple Households
Married-couple Households Comparison
Immigrants from St. Vincent and the Grenadines
Immigrants from Uganda
38.7%
MARRIED-COUPLE HOUSEHOLDS
0.0/ 100
METRIC RATING
334th/ 347
METRIC RANK
44.6%
MARRIED-COUPLE HOUSEHOLDS
1.5/ 100
METRIC RATING
233rd/ 347
METRIC RANK
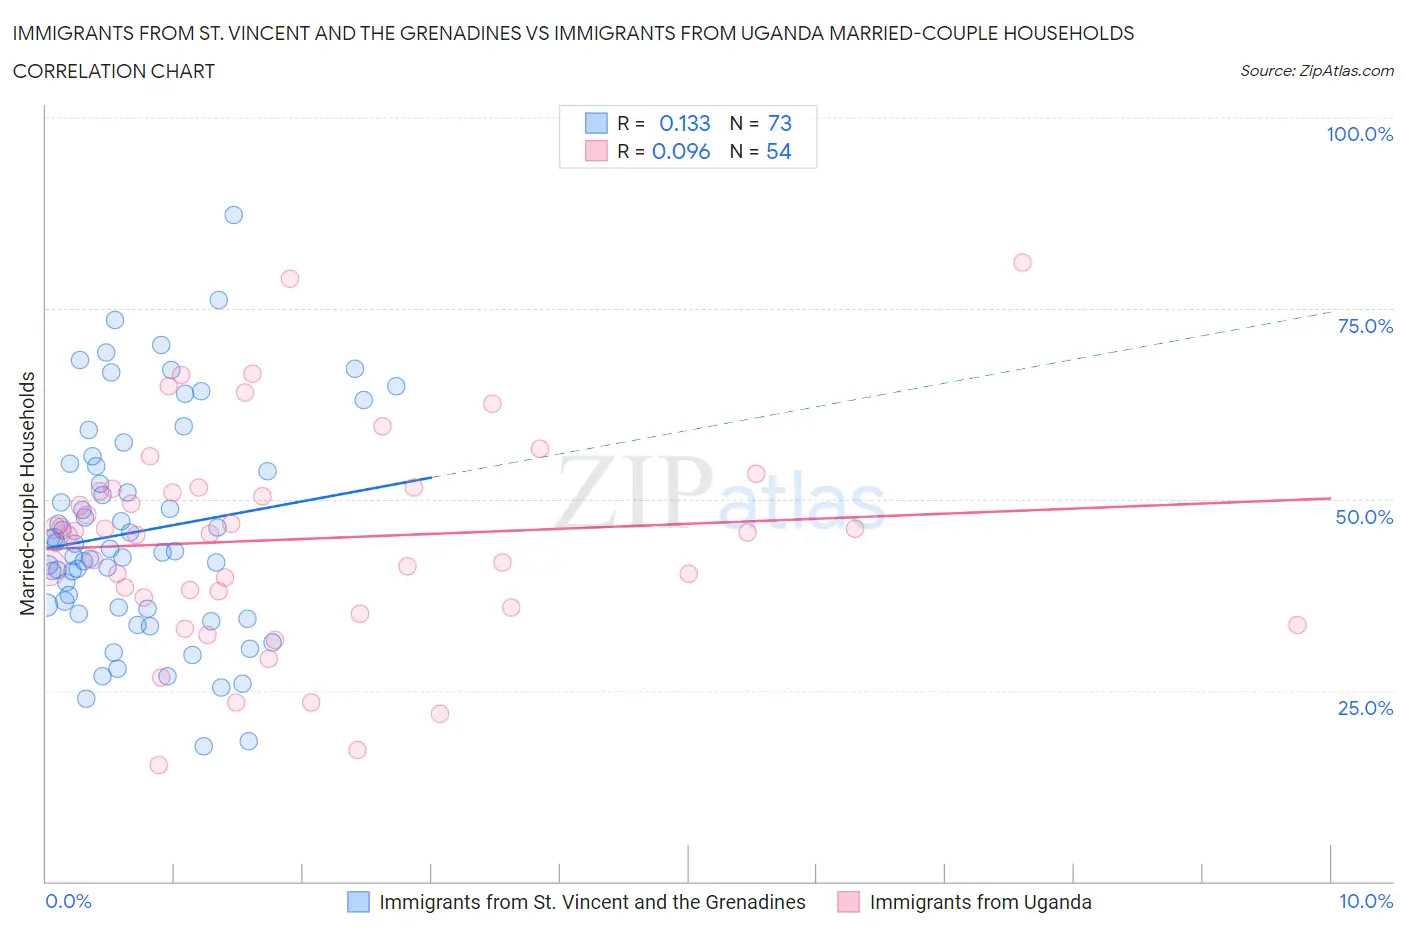
Immigrants from St. Vincent and the Grenadines vs Immigrants from Uganda Married-couple Households Correlation Chart
The statistical analysis conducted on geographies consisting of 56,188,620 people shows a poor positive correlation between the proportion of Immigrants from St. Vincent and the Grenadines and percentage of married-couple family households in the United States with a correlation coefficient (R) of 0.133 and weighted average of 38.7%. Similarly, the statistical analysis conducted on geographies consisting of 125,974,849 people shows a slight positive correlation between the proportion of Immigrants from Uganda and percentage of married-couple family households in the United States with a correlation coefficient (R) of 0.096 and weighted average of 44.6%, a difference of 15.3%.
Married-couple Households Correlation Summary
| Measurement | Immigrants from St. Vincent and the Grenadines | Immigrants from Uganda |
| Minimum | 17.7% | 15.2% |
| Maximum | 87.2% | 81.0% |
| Range | 69.5% | 65.8% |
| Mean | 45.8% | 44.8% |
| Median | 43.5% | 45.6% |
| Interquartile 25% (IQ1) | 35.8% | 37.2% |
| Interquartile 75% (IQ3) | 54.5% | 51.4% |
| Interquartile Range (IQR) | 18.8% | 14.2% |
| Standard Deviation (Sample) | 14.4% | 13.8% |
| Standard Deviation (Population) | 14.3% | 13.7% |
Similar Demographics by Married-couple Households
Demographics Similar to Immigrants from St. Vincent and the Grenadines by Married-couple Households
In terms of married-couple households, the demographic groups most similar to Immigrants from St. Vincent and the Grenadines are Senegalese (38.6%, a difference of 0.33%), Black/African American (38.5%, a difference of 0.51%), Immigrants from Somalia (38.4%, a difference of 0.66%), Immigrants from West Indies (39.0%, a difference of 0.78%), and Somali (39.0%, a difference of 0.81%).
| Demographics | Rating | Rank | Married-couple Households |
| Lumbee | 0.0 /100 | #327 | Tragic 39.6% |
| Barbadians | 0.0 /100 | #328 | Tragic 39.4% |
| Immigrants | Dominica | 0.0 /100 | #329 | Tragic 39.4% |
| Immigrants | Barbados | 0.0 /100 | #330 | Tragic 39.2% |
| Immigrants | Congo | 0.0 /100 | #331 | Tragic 39.0% |
| Somalis | 0.0 /100 | #332 | Tragic 39.0% |
| Immigrants | West Indies | 0.0 /100 | #333 | Tragic 39.0% |
| Immigrants | St. Vincent and the Grenadines | 0.0 /100 | #334 | Tragic 38.7% |
| Senegalese | 0.0 /100 | #335 | Tragic 38.6% |
| Blacks/African Americans | 0.0 /100 | #336 | Tragic 38.5% |
| Immigrants | Somalia | 0.0 /100 | #337 | Tragic 38.4% |
| Immigrants | Senegal | 0.0 /100 | #338 | Tragic 38.4% |
| British West Indians | 0.0 /100 | #339 | Tragic 38.3% |
| Dominicans | 0.0 /100 | #340 | Tragic 38.2% |
| Cape Verdeans | 0.0 /100 | #341 | Tragic 38.1% |
Demographics Similar to Immigrants from Uganda by Married-couple Households
In terms of married-couple households, the demographic groups most similar to Immigrants from Uganda are Houma (44.6%, a difference of 0.040%), Marshallese (44.6%, a difference of 0.040%), Soviet Union (44.6%, a difference of 0.050%), Immigrants from Latin America (44.7%, a difference of 0.090%), and Immigrants from Panama (44.6%, a difference of 0.12%).
| Demographics | Rating | Rank | Married-couple Households |
| Alsatians | 2.3 /100 | #226 | Tragic 44.8% |
| Salvadorans | 1.9 /100 | #227 | Tragic 44.7% |
| Kenyans | 1.7 /100 | #228 | Tragic 44.7% |
| Immigrants | Latin America | 1.6 /100 | #229 | Tragic 44.7% |
| Soviet Union | 1.6 /100 | #230 | Tragic 44.6% |
| Houma | 1.5 /100 | #231 | Tragic 44.6% |
| Marshallese | 1.5 /100 | #232 | Tragic 44.6% |
| Immigrants | Uganda | 1.5 /100 | #233 | Tragic 44.6% |
| Immigrants | Panama | 1.3 /100 | #234 | Tragic 44.6% |
| Immigrants | Nicaragua | 1.2 /100 | #235 | Tragic 44.5% |
| Yaqui | 1.2 /100 | #236 | Tragic 44.5% |
| Comanche | 1.2 /100 | #237 | Tragic 44.5% |
| Immigrants | Uruguay | 1.1 /100 | #238 | Tragic 44.5% |
| Spanish Americans | 1.1 /100 | #239 | Tragic 44.5% |
| Ute | 1.0 /100 | #240 | Tragic 44.4% |