Immigrants from Zimbabwe vs Taiwanese Family Households with Children
COMPARE
Immigrants from Zimbabwe
Taiwanese
Family Households with Children
Family Households with Children Comparison
Immigrants from Zimbabwe
Taiwanese
27.8%
FAMILY HOUSEHOLDS WITH CHILDREN
92.8/ 100
METRIC RATING
122nd/ 347
METRIC RANK
26.7%
FAMILY HOUSEHOLDS WITH CHILDREN
0.9/ 100
METRIC RATING
264th/ 347
METRIC RANK
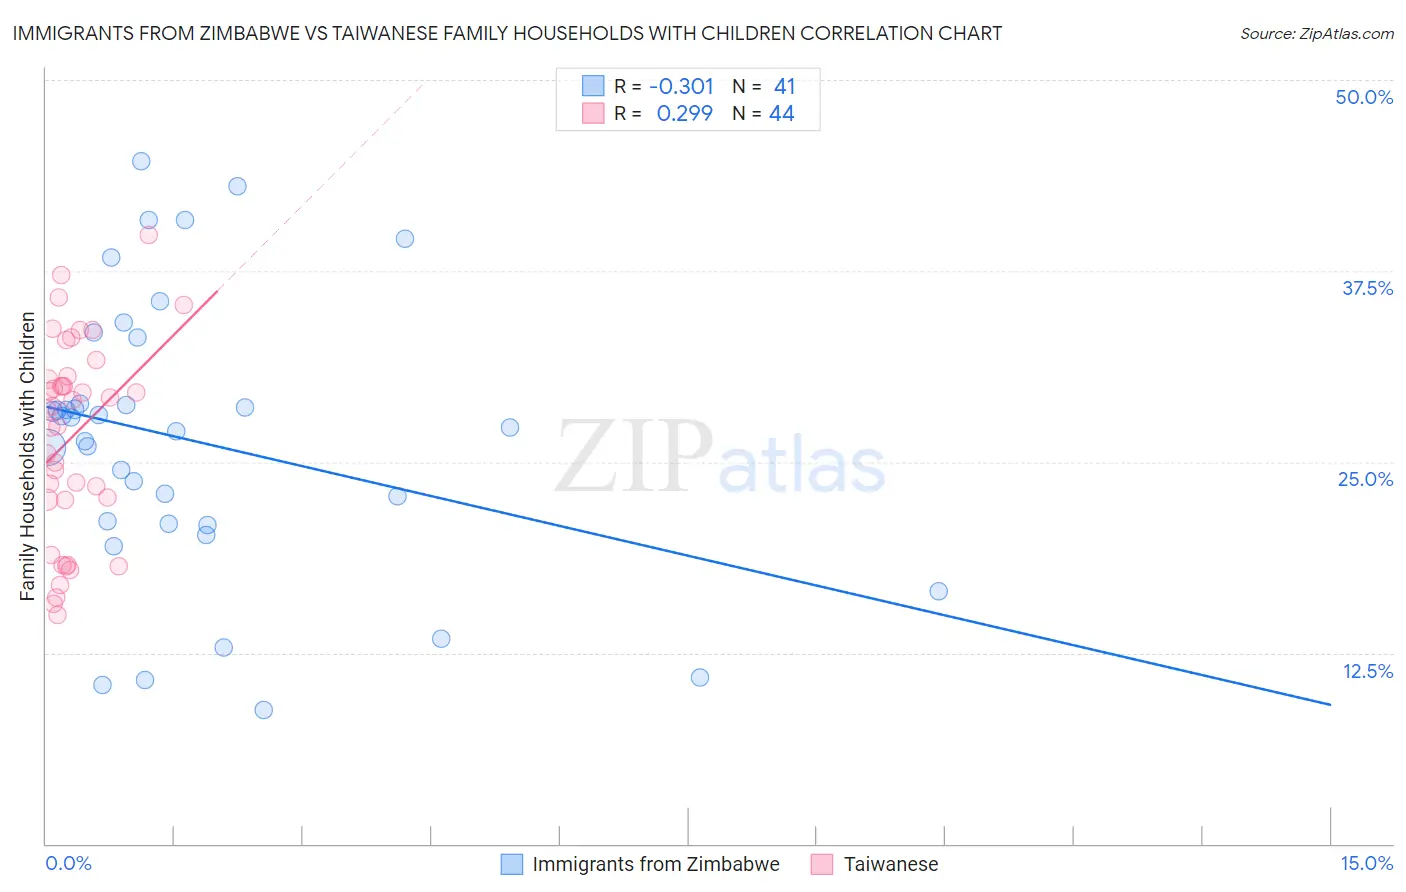
Immigrants from Zimbabwe vs Taiwanese Family Households with Children Correlation Chart
The statistical analysis conducted on geographies consisting of 117,786,301 people shows a mild negative correlation between the proportion of Immigrants from Zimbabwe and percentage of family households with children in the United States with a correlation coefficient (R) of -0.301 and weighted average of 27.8%. Similarly, the statistical analysis conducted on geographies consisting of 31,709,765 people shows a weak positive correlation between the proportion of Taiwanese and percentage of family households with children in the United States with a correlation coefficient (R) of 0.299 and weighted average of 26.7%, a difference of 4.1%.
Family Households with Children Correlation Summary
| Measurement | Immigrants from Zimbabwe | Taiwanese |
| Minimum | 8.8% | 15.0% |
| Maximum | 44.7% | 39.9% |
| Range | 35.9% | 24.9% |
| Mean | 26.3% | 26.7% |
| Median | 27.3% | 28.5% |
| Interquartile 25% (IQ1) | 20.9% | 22.5% |
| Interquartile 75% (IQ3) | 31.0% | 30.5% |
| Interquartile Range (IQR) | 10.1% | 8.0% |
| Standard Deviation (Sample) | 9.1% | 6.4% |
| Standard Deviation (Population) | 9.0% | 6.4% |
Similar Demographics by Family Households with Children
Demographics Similar to Immigrants from Zimbabwe by Family Households with Children
In terms of family households with children, the demographic groups most similar to Immigrants from Zimbabwe are Immigrants from Western Asia (27.9%, a difference of 0.070%), Immigrants from Northern Africa (27.8%, a difference of 0.070%), Immigrants from Singapore (27.8%, a difference of 0.14%), Ecuadorian (27.8%, a difference of 0.14%), and Immigrants from Ethiopia (27.8%, a difference of 0.16%).
| Demographics | Rating | Rank | Family Households with Children |
| Immigrants | Africa | 96.8 /100 | #115 | Exceptional 28.0% |
| Pakistanis | 96.0 /100 | #116 | Exceptional 27.9% |
| Immigrants | Malaysia | 95.9 /100 | #117 | Exceptional 27.9% |
| Central American Indians | 95.9 /100 | #118 | Exceptional 27.9% |
| Zimbabweans | 95.6 /100 | #119 | Exceptional 27.9% |
| Europeans | 95.4 /100 | #120 | Exceptional 27.9% |
| Immigrants | Western Asia | 93.6 /100 | #121 | Exceptional 27.9% |
| Immigrants | Zimbabwe | 92.8 /100 | #122 | Exceptional 27.8% |
| Immigrants | Northern Africa | 91.8 /100 | #123 | Exceptional 27.8% |
| Immigrants | Singapore | 90.8 /100 | #124 | Exceptional 27.8% |
| Ecuadorians | 90.8 /100 | #125 | Exceptional 27.8% |
| Immigrants | Ethiopia | 90.5 /100 | #126 | Exceptional 27.8% |
| Belizeans | 90.0 /100 | #127 | Exceptional 27.8% |
| Syrians | 89.7 /100 | #128 | Excellent 27.8% |
| Immigrants | Eritrea | 89.4 /100 | #129 | Excellent 27.8% |
Demographics Similar to Taiwanese by Family Households with Children
In terms of family households with children, the demographic groups most similar to Taiwanese are Chippewa (26.7%, a difference of 0.010%), Maltese (26.7%, a difference of 0.010%), Immigrants from Uzbekistan (26.7%, a difference of 0.010%), Immigrants from Belgium (26.7%, a difference of 0.020%), and Immigrants from North Macedonia (26.7%, a difference of 0.030%).
| Demographics | Rating | Rank | Family Households with Children |
| Slavs | 1.3 /100 | #257 | Tragic 26.8% |
| Immigrants | Cuba | 1.3 /100 | #258 | Tragic 26.8% |
| Immigrants | Lithuania | 1.2 /100 | #259 | Tragic 26.8% |
| Immigrants | Jamaica | 1.2 /100 | #260 | Tragic 26.8% |
| Immigrants | Belarus | 1.1 /100 | #261 | Tragic 26.8% |
| Immigrants | Russia | 1.0 /100 | #262 | Tragic 26.8% |
| Immigrants | North Macedonia | 1.0 /100 | #263 | Tragic 26.7% |
| Taiwanese | 0.9 /100 | #264 | Tragic 26.7% |
| Chippewa | 0.9 /100 | #265 | Tragic 26.7% |
| Maltese | 0.9 /100 | #266 | Tragic 26.7% |
| Immigrants | Uzbekistan | 0.9 /100 | #267 | Tragic 26.7% |
| Immigrants | Belgium | 0.9 /100 | #268 | Tragic 26.7% |
| Immigrants | Denmark | 0.8 /100 | #269 | Tragic 26.7% |
| Immigrants | Zaire | 0.7 /100 | #270 | Tragic 26.7% |
| French | 0.7 /100 | #271 | Tragic 26.7% |