Immigrants from Uzbekistan vs Taiwanese Family Households with Children
COMPARE
Immigrants from Uzbekistan
Taiwanese
Family Households with Children
Family Households with Children Comparison
Immigrants from Uzbekistan
Taiwanese
26.7%
FAMILY HOUSEHOLDS WITH CHILDREN
0.9/ 100
METRIC RATING
267th/ 347
METRIC RANK
26.7%
FAMILY HOUSEHOLDS WITH CHILDREN
0.9/ 100
METRIC RATING
264th/ 347
METRIC RANK
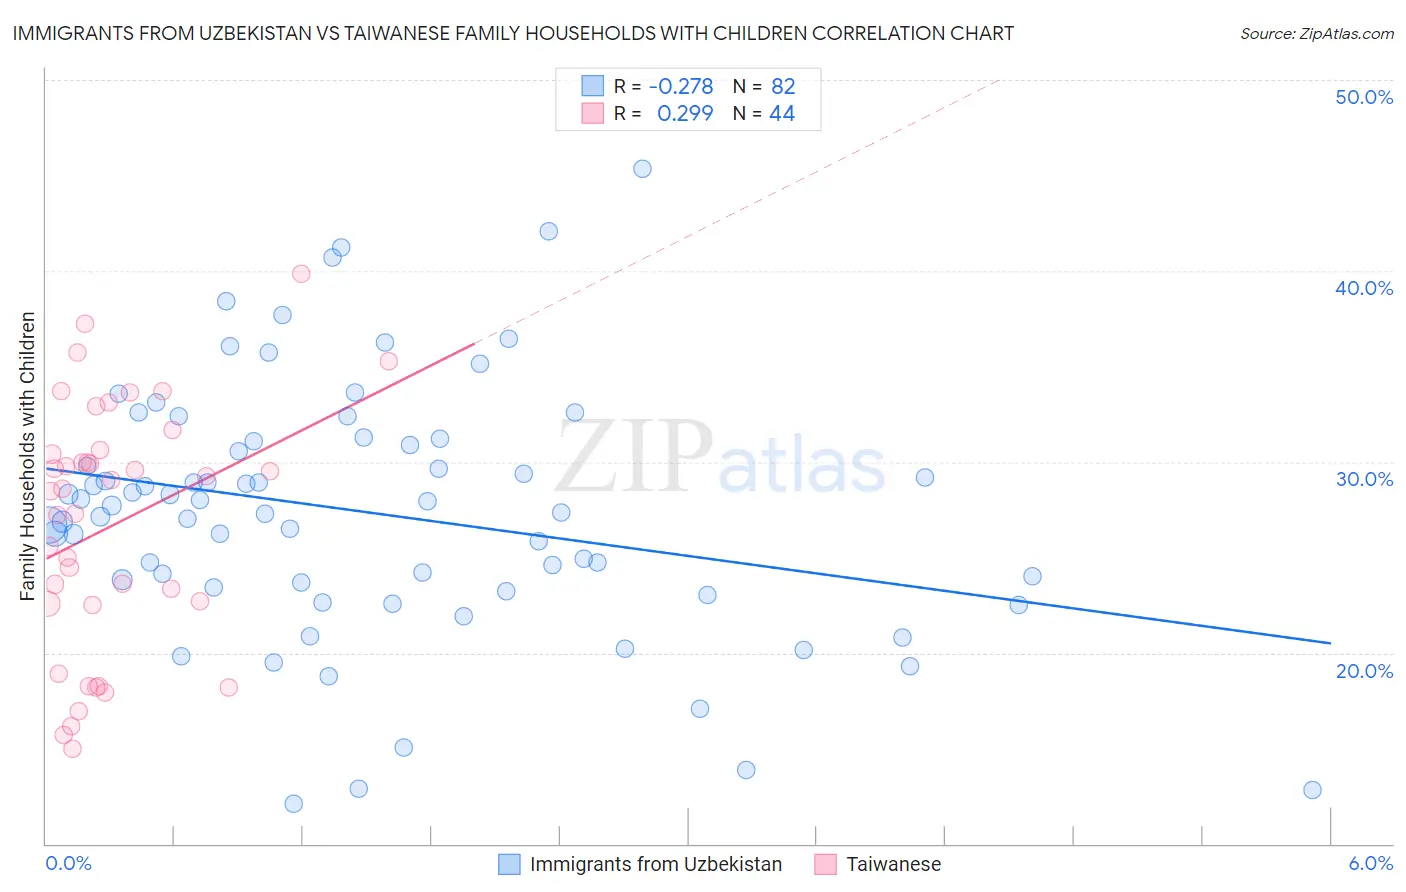
Immigrants from Uzbekistan vs Taiwanese Family Households with Children Correlation Chart
The statistical analysis conducted on geographies consisting of 118,662,490 people shows a weak negative correlation between the proportion of Immigrants from Uzbekistan and percentage of family households with children in the United States with a correlation coefficient (R) of -0.278 and weighted average of 26.7%. Similarly, the statistical analysis conducted on geographies consisting of 31,709,765 people shows a weak positive correlation between the proportion of Taiwanese and percentage of family households with children in the United States with a correlation coefficient (R) of 0.299 and weighted average of 26.7%, a difference of 0.010%.
Family Households with Children Correlation Summary
| Measurement | Immigrants from Uzbekistan | Taiwanese |
| Minimum | 12.1% | 15.0% |
| Maximum | 45.4% | 39.9% |
| Range | 33.3% | 24.9% |
| Mean | 27.3% | 26.7% |
| Median | 27.5% | 28.5% |
| Interquartile 25% (IQ1) | 23.4% | 22.5% |
| Interquartile 75% (IQ3) | 31.1% | 30.5% |
| Interquartile Range (IQR) | 7.7% | 8.0% |
| Standard Deviation (Sample) | 6.7% | 6.4% |
| Standard Deviation (Population) | 6.6% | 6.4% |
Demographics Similar to Immigrants from Uzbekistan and Taiwanese by Family Households with Children
In terms of family households with children, the demographic groups most similar to Immigrants from Uzbekistan are Maltese (26.7%, a difference of 0.0%), Chippewa (26.7%, a difference of 0.010%), Immigrants from Belgium (26.7%, a difference of 0.010%), Immigrants from Russia (26.8%, a difference of 0.050%), and Immigrants from North Macedonia (26.7%, a difference of 0.050%). Similarly, the demographic groups most similar to Taiwanese are Chippewa (26.7%, a difference of 0.010%), Maltese (26.7%, a difference of 0.010%), Immigrants from Belgium (26.7%, a difference of 0.020%), Immigrants from North Macedonia (26.7%, a difference of 0.030%), and Immigrants from Russia (26.8%, a difference of 0.040%).
| Demographics | Rating | Rank | Family Households with Children |
| German Russians | 1.5 /100 | #255 | Tragic 26.8% |
| Scotch-Irish | 1.4 /100 | #256 | Tragic 26.8% |
| Slavs | 1.3 /100 | #257 | Tragic 26.8% |
| Immigrants | Cuba | 1.3 /100 | #258 | Tragic 26.8% |
| Immigrants | Lithuania | 1.2 /100 | #259 | Tragic 26.8% |
| Immigrants | Jamaica | 1.2 /100 | #260 | Tragic 26.8% |
| Immigrants | Belarus | 1.1 /100 | #261 | Tragic 26.8% |
| Immigrants | Russia | 1.0 /100 | #262 | Tragic 26.8% |
| Immigrants | North Macedonia | 1.0 /100 | #263 | Tragic 26.7% |
| Taiwanese | 0.9 /100 | #264 | Tragic 26.7% |
| Chippewa | 0.9 /100 | #265 | Tragic 26.7% |
| Maltese | 0.9 /100 | #266 | Tragic 26.7% |
| Immigrants | Uzbekistan | 0.9 /100 | #267 | Tragic 26.7% |
| Immigrants | Belgium | 0.9 /100 | #268 | Tragic 26.7% |
| Immigrants | Denmark | 0.8 /100 | #269 | Tragic 26.7% |
| Immigrants | Zaire | 0.7 /100 | #270 | Tragic 26.7% |
| French | 0.7 /100 | #271 | Tragic 26.7% |
| Somalis | 0.7 /100 | #272 | Tragic 26.7% |
| Immigrants | Hungary | 0.6 /100 | #273 | Tragic 26.7% |
| Eastern Europeans | 0.6 /100 | #274 | Tragic 26.7% |
| Immigrants | Northern Europe | 0.5 /100 | #275 | Tragic 26.7% |