Panamanian vs Moroccan Family Households with Children
COMPARE
Panamanian
Moroccan
Family Households with Children
Family Households with Children Comparison
Panamanians
Moroccans
28.2%
FAMILY HOUSEHOLDS WITH CHILDREN
99.3/ 100
METRIC RATING
93rd/ 347
METRIC RANK
26.9%
FAMILY HOUSEHOLDS WITH CHILDREN
3.4/ 100
METRIC RATING
238th/ 347
METRIC RANK
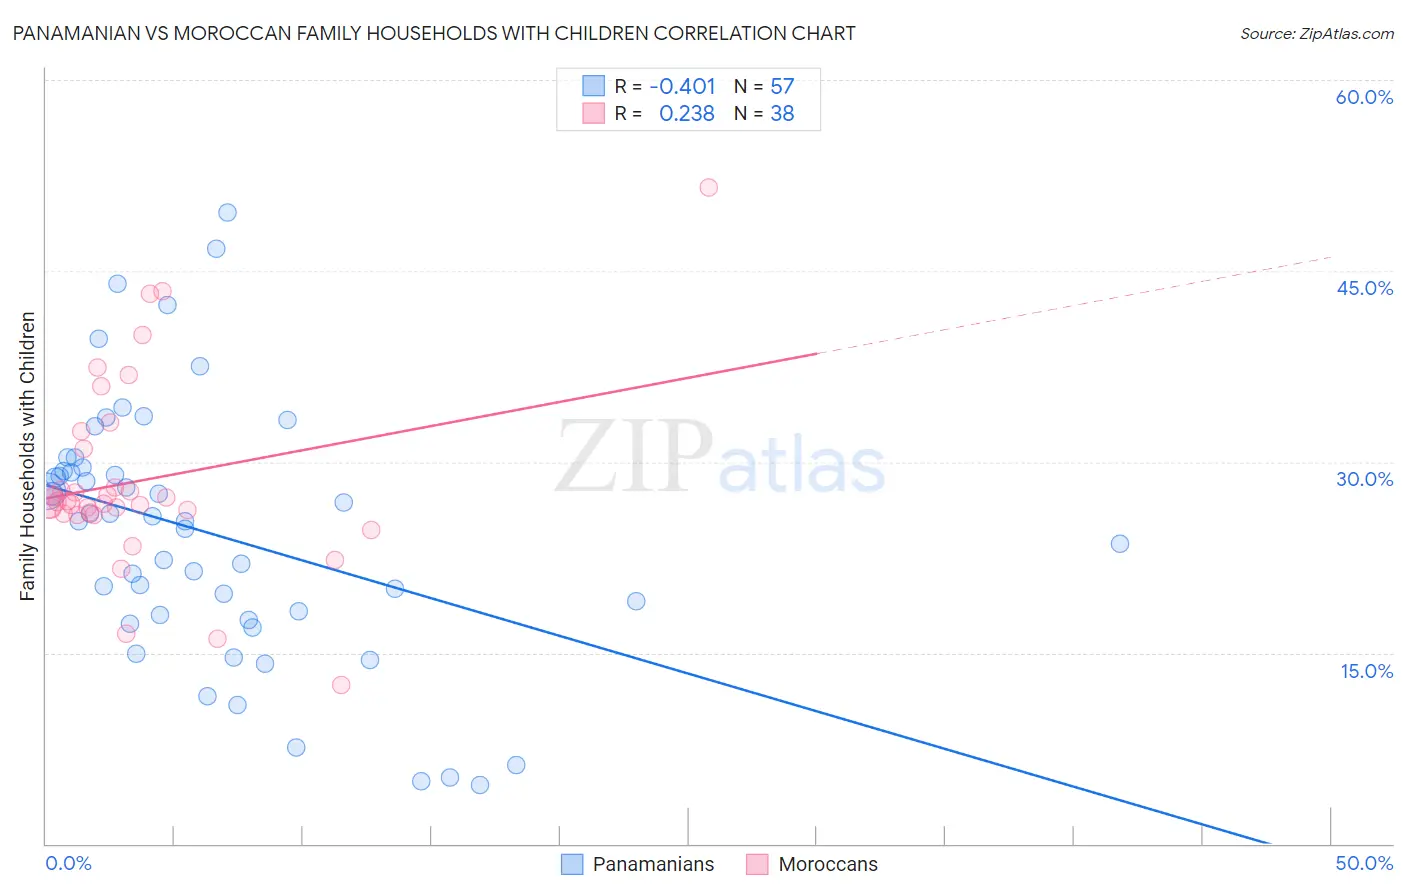
Panamanian vs Moroccan Family Households with Children Correlation Chart
The statistical analysis conducted on geographies consisting of 281,035,493 people shows a moderate negative correlation between the proportion of Panamanians and percentage of family households with children in the United States with a correlation coefficient (R) of -0.401 and weighted average of 28.2%. Similarly, the statistical analysis conducted on geographies consisting of 201,690,181 people shows a weak positive correlation between the proportion of Moroccans and percentage of family households with children in the United States with a correlation coefficient (R) of 0.238 and weighted average of 26.9%, a difference of 4.6%.
Family Households with Children Correlation Summary
| Measurement | Panamanian | Moroccan |
| Minimum | 4.6% | 12.4% |
| Maximum | 49.6% | 51.6% |
| Range | 45.0% | 39.1% |
| Mean | 24.4% | 28.5% |
| Median | 25.4% | 26.9% |
| Interquartile 25% (IQ1) | 17.8% | 25.9% |
| Interquartile 75% (IQ3) | 29.4% | 31.0% |
| Interquartile Range (IQR) | 11.7% | 5.1% |
| Standard Deviation (Sample) | 10.2% | 7.5% |
| Standard Deviation (Population) | 10.1% | 7.4% |
Similar Demographics by Family Households with Children
Demographics Similar to Panamanians by Family Households with Children
In terms of family households with children, the demographic groups most similar to Panamanians are Immigrants from Colombia (28.2%, a difference of 0.050%), Chickasaw (28.2%, a difference of 0.11%), Immigrants from Nicaragua (28.2%, a difference of 0.11%), Immigrants from Liberia (28.2%, a difference of 0.13%), and Ute (28.2%, a difference of 0.14%).
| Demographics | Rating | Rank | Family Households with Children |
| Immigrants | Western Africa | 99.6 /100 | #86 | Exceptional 28.3% |
| Colombians | 99.6 /100 | #87 | Exceptional 28.3% |
| Liberians | 99.6 /100 | #88 | Exceptional 28.3% |
| Immigrants | Costa Rica | 99.6 /100 | #89 | Exceptional 28.3% |
| Immigrants | Thailand | 99.5 /100 | #90 | Exceptional 28.2% |
| Immigrants | Liberia | 99.4 /100 | #91 | Exceptional 28.2% |
| Chickasaw | 99.4 /100 | #92 | Exceptional 28.2% |
| Panamanians | 99.3 /100 | #93 | Exceptional 28.2% |
| Immigrants | Colombia | 99.2 /100 | #94 | Exceptional 28.2% |
| Immigrants | Nicaragua | 99.1 /100 | #95 | Exceptional 28.2% |
| Ute | 99.1 /100 | #96 | Exceptional 28.2% |
| Chileans | 98.9 /100 | #97 | Exceptional 28.1% |
| Immigrants | Kenya | 98.9 /100 | #98 | Exceptional 28.1% |
| Immigrants | Azores | 98.8 /100 | #99 | Exceptional 28.1% |
| Indonesians | 98.8 /100 | #100 | Exceptional 28.1% |
Demographics Similar to Moroccans by Family Households with Children
In terms of family households with children, the demographic groups most similar to Moroccans are Immigrants from Netherlands (26.9%, a difference of 0.010%), Immigrants from Southern Europe (26.9%, a difference of 0.010%), Cape Verdean (26.9%, a difference of 0.020%), Immigrants from Bulgaria (26.9%, a difference of 0.020%), and Navajo (26.9%, a difference of 0.030%).
| Demographics | Rating | Rank | Family Households with Children |
| Luxembourgers | 5.5 /100 | #231 | Tragic 27.0% |
| Yugoslavians | 5.1 /100 | #232 | Tragic 27.0% |
| Immigrants | Italy | 5.0 /100 | #233 | Tragic 27.0% |
| Immigrants | Germany | 4.4 /100 | #234 | Tragic 27.0% |
| Immigrants | Morocco | 4.2 /100 | #235 | Tragic 27.0% |
| Cape Verdeans | 3.6 /100 | #236 | Tragic 26.9% |
| Immigrants | Netherlands | 3.5 /100 | #237 | Tragic 26.9% |
| Moroccans | 3.4 /100 | #238 | Tragic 26.9% |
| Immigrants | Southern Europe | 3.4 /100 | #239 | Tragic 26.9% |
| Immigrants | Bulgaria | 3.3 /100 | #240 | Tragic 26.9% |
| Navajo | 3.2 /100 | #241 | Tragic 26.9% |
| Immigrants | England | 3.2 /100 | #242 | Tragic 26.9% |
| Immigrants | Saudi Arabia | 2.9 /100 | #243 | Tragic 26.9% |
| Ukrainians | 2.9 /100 | #244 | Tragic 26.9% |
| Australians | 2.8 /100 | #245 | Tragic 26.9% |