Seminole vs Apache Family Households
COMPARE
Seminole
Apache
Family Households
Family Households Comparison
Seminole
Apache
64.0%
FAMILY HOUSEHOLDS
18.9/ 100
METRIC RATING
197th/ 347
METRIC RANK
66.5%
FAMILY HOUSEHOLDS
100.0/ 100
METRIC RATING
43rd/ 347
METRIC RANK
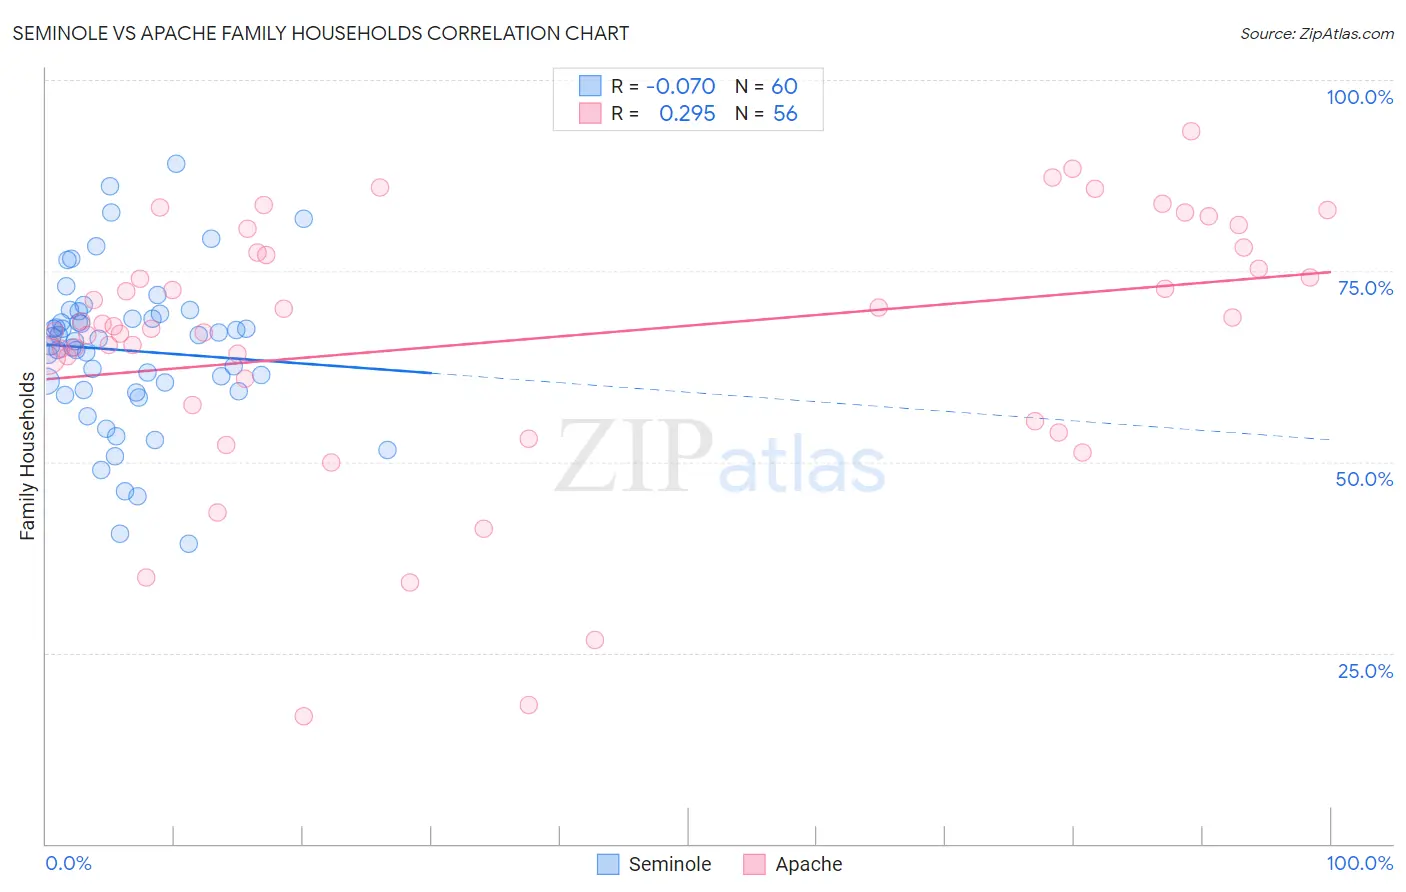
Seminole vs Apache Family Households Correlation Chart
The statistical analysis conducted on geographies consisting of 118,298,678 people shows a slight negative correlation between the proportion of Seminole and percentage of family households in the United States with a correlation coefficient (R) of -0.070 and weighted average of 64.0%. Similarly, the statistical analysis conducted on geographies consisting of 231,040,944 people shows a weak positive correlation between the proportion of Apache and percentage of family households in the United States with a correlation coefficient (R) of 0.295 and weighted average of 66.5%, a difference of 4.0%.
Family Households Correlation Summary
| Measurement | Seminole | Apache |
| Minimum | 39.3% | 16.7% |
| Maximum | 89.0% | 93.2% |
| Range | 49.7% | 76.6% |
| Mean | 64.6% | 66.0% |
| Median | 65.9% | 67.9% |
| Interquartile 25% (IQ1) | 59.4% | 59.1% |
| Interquartile 75% (IQ3) | 69.1% | 77.7% |
| Interquartile Range (IQR) | 9.7% | 18.6% |
| Standard Deviation (Sample) | 10.1% | 17.1% |
| Standard Deviation (Population) | 10.0% | 16.9% |
Similar Demographics by Family Households
Demographics Similar to Seminole by Family Households
In terms of family households, the demographic groups most similar to Seminole are Polish (64.0%, a difference of 0.0%), Immigrants from Canada (64.0%, a difference of 0.010%), Slavic (64.0%, a difference of 0.010%), Immigrants from North America (64.0%, a difference of 0.020%), and Immigrants from Malaysia (64.0%, a difference of 0.020%).
| Demographics | Rating | Rank | Family Households |
| Zimbabweans | 24.7 /100 | #190 | Fair 64.1% |
| Arabs | 24.5 /100 | #191 | Fair 64.1% |
| Lithuanians | 23.8 /100 | #192 | Fair 64.0% |
| French | 23.7 /100 | #193 | Fair 64.0% |
| Paiute | 22.2 /100 | #194 | Fair 64.0% |
| Immigrants | North America | 20.0 /100 | #195 | Poor 64.0% |
| Immigrants | Canada | 19.2 /100 | #196 | Poor 64.0% |
| Seminole | 18.9 /100 | #197 | Poor 64.0% |
| Poles | 18.9 /100 | #198 | Poor 64.0% |
| Slavs | 18.6 /100 | #199 | Poor 64.0% |
| Immigrants | Malaysia | 17.9 /100 | #200 | Poor 64.0% |
| Immigrants | Eastern Europe | 17.2 /100 | #201 | Poor 64.0% |
| Iranians | 13.5 /100 | #202 | Poor 63.9% |
| Norwegians | 13.2 /100 | #203 | Poor 63.9% |
| Immigrants | Uruguay | 12.8 /100 | #204 | Poor 63.9% |
Demographics Similar to Apache by Family Households
In terms of family households, the demographic groups most similar to Apache are Menominee (66.5%, a difference of 0.010%), Asian (66.5%, a difference of 0.050%), Immigrants from Bolivia (66.6%, a difference of 0.070%), Venezuelan (66.5%, a difference of 0.070%), and Arapaho (66.5%, a difference of 0.090%).
| Demographics | Rating | Rank | Family Households |
| Peruvians | 100.0 /100 | #36 | Exceptional 67.1% |
| Tsimshian | 100.0 /100 | #37 | Exceptional 67.1% |
| Mexican American Indians | 100.0 /100 | #38 | Exceptional 67.0% |
| Immigrants | El Salvador | 100.0 /100 | #39 | Exceptional 67.0% |
| Guamanians/Chamorros | 100.0 /100 | #40 | Exceptional 66.6% |
| Immigrants | Bolivia | 100.0 /100 | #41 | Exceptional 66.6% |
| Menominee | 100.0 /100 | #42 | Exceptional 66.5% |
| Apache | 100.0 /100 | #43 | Exceptional 66.5% |
| Asians | 100.0 /100 | #44 | Exceptional 66.5% |
| Venezuelans | 100.0 /100 | #45 | Exceptional 66.5% |
| Arapaho | 100.0 /100 | #46 | Exceptional 66.5% |
| Bolivians | 100.0 /100 | #47 | Exceptional 66.5% |
| Immigrants | Venezuela | 100.0 /100 | #48 | Exceptional 66.4% |
| Immigrants | South Central Asia | 100.0 /100 | #49 | Exceptional 66.4% |
| Navajo | 100.0 /100 | #50 | Exceptional 66.4% |